The S&P 500 recorded the best week since November 2023. Weekly market recap, trading week 17/2024
Summary of the trading week in several posts with the most interactions on X
In this series, I’ve been bringing out financial posts with the largest number of interactions from my feed on the X platform over the most recent week. I am aware that not everybody uses X regularly so I thought it could provide some value to your analysis, and investment process.
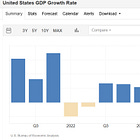
That was a pretty busy week. We had US GDP and PCE inflation data for Q1 2024, March PCE inflation, and some big tech stocks earnings. Before we move into the market posts recap you can find below the summary of the US GDP and PCE inflation data for Q1 as well as Microsoft and Google earnings:
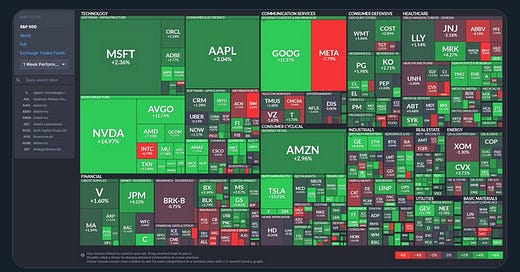
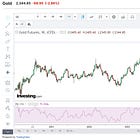
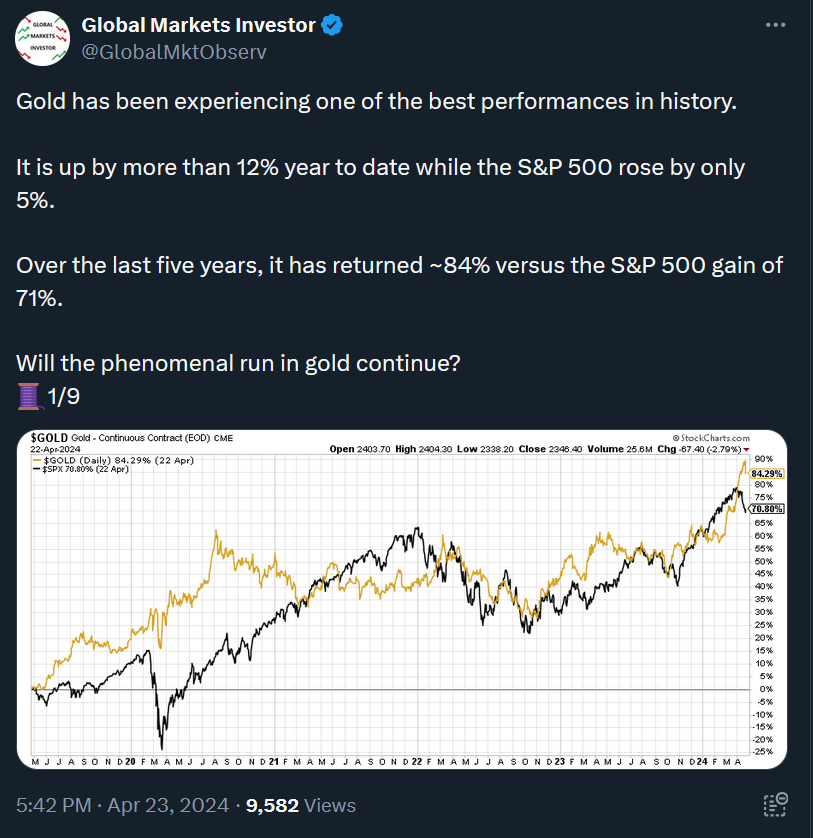
1) Weekly performance. In the below attachment, you can see last week’s performance of the major US indexes, the VIX volatility index, gold, and Bitcoin. After a rough first three weeks of April, US stocks have finally seen some relief. The S&P 500 rallied by 2.7%, recording the best weekly performance since November 2023. The index, though, did not manage to decisively break above 5,100 and sits below its 50-day moving average. Moreover, the volatility index VIX has crushed by 20% in the largest move since October 2023. Overall, however, some cautiousness is still necessary unless the S&P 500 closes above 5,100 and its 50-day moving average. In terms of other assets, gold has seen some pullback and was down by almost 3% during the week. More on that in the below story:
Going forward, markets are awaiting another huge week:
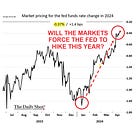
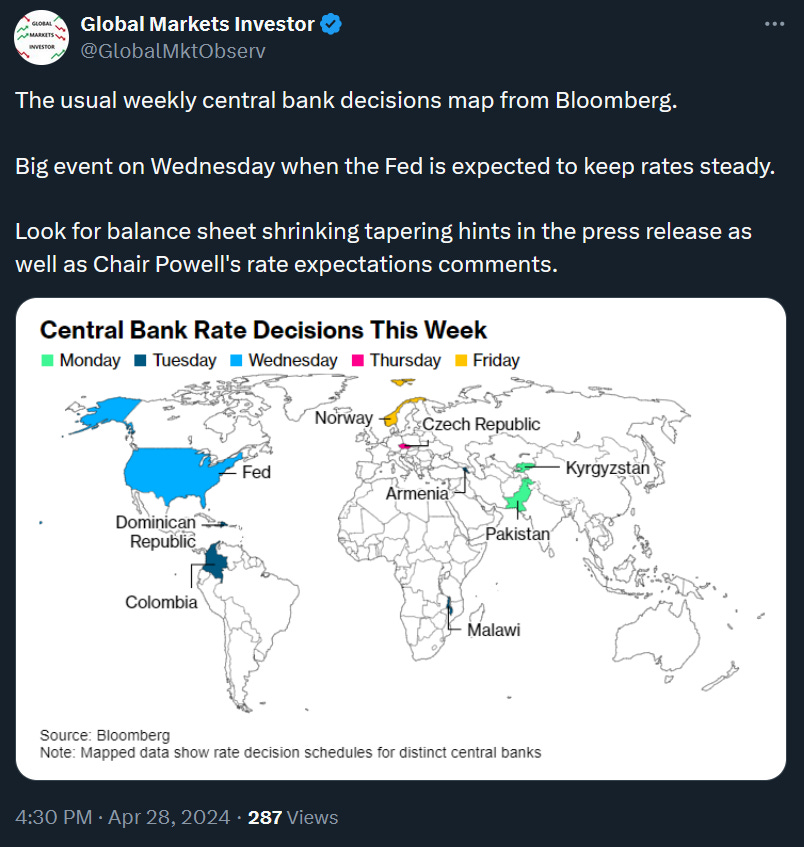
1) US JOLTS Jobs data and the Fed interest rate decision on Wednesday. The full Fed meeting preview can be found in the below article:
2) ~20% of the S&P 500 companies report their quarterly earnings with Amazon and Apple scheduled to release after market close on Tuesday and Thursday, respectively.
3) US ISM Non-Manufacturing PMI data and US Non-Farm Payrolls Report, both on Friday.
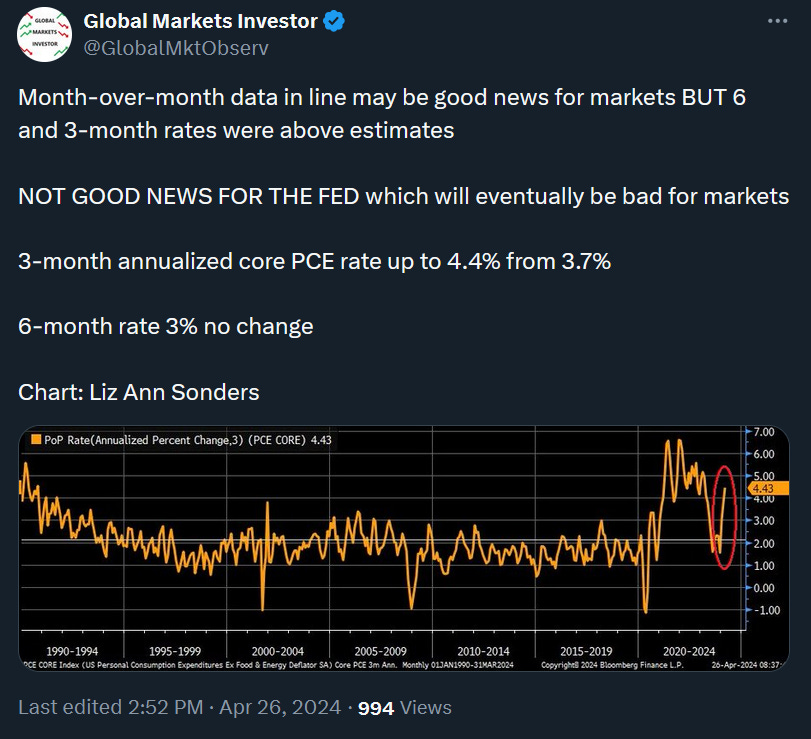
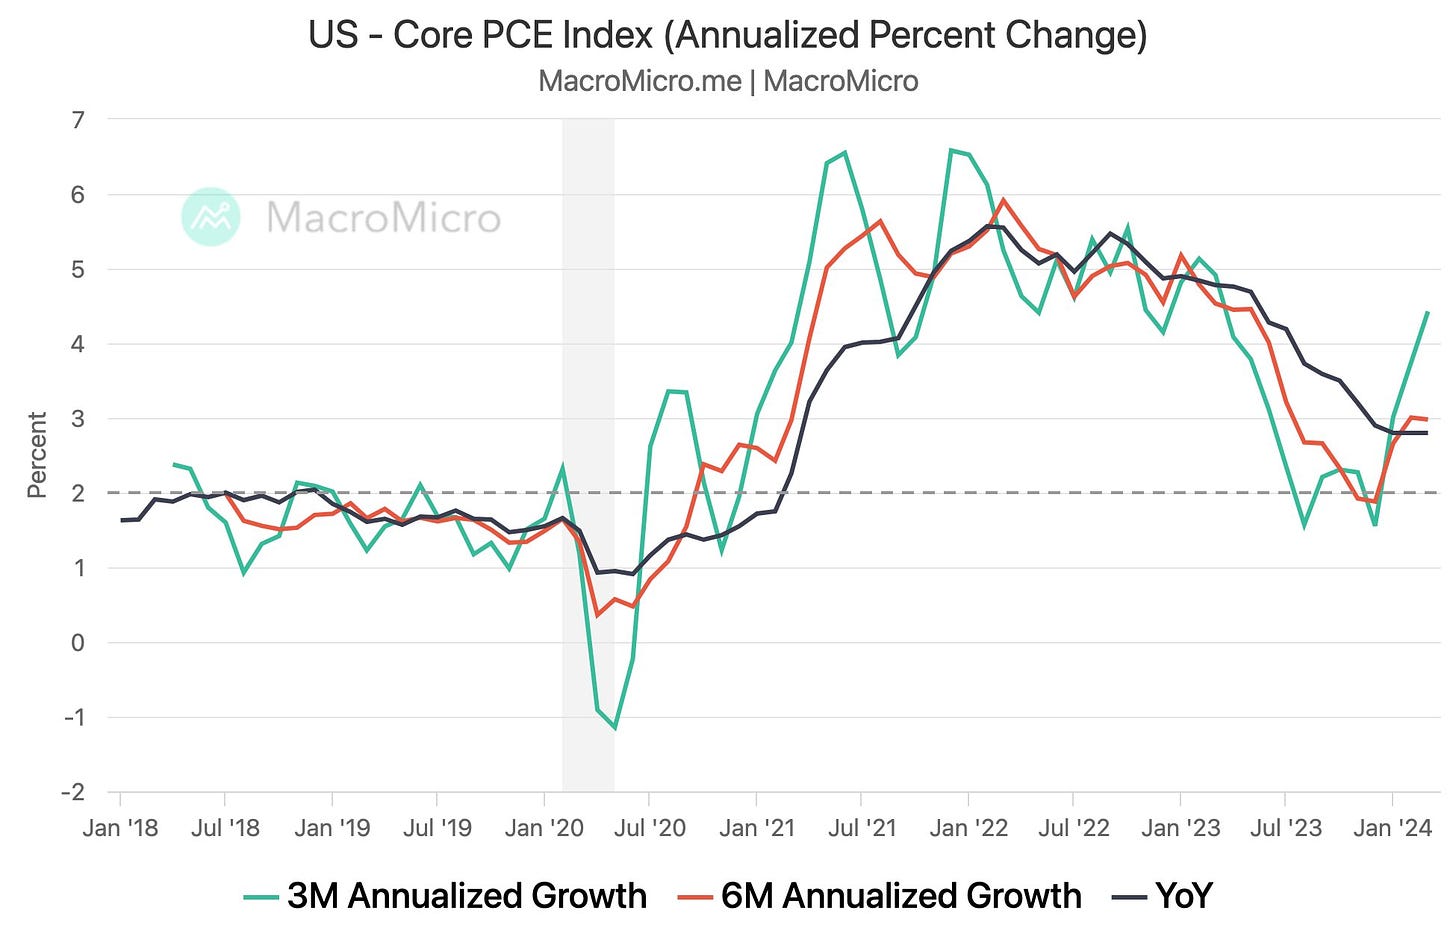
2) US PCE Inflation data for March. On Friday, all market watchers’ eyes were on the data release of the most important, Fed's preferred inflation gauge, the PCE (Personal Consumption Expenditures Price Index). U.S. Bureau of Economic Analysis reported that the PCE Price Index rose 2.7% year-over-year in March above an estimated 2.6% while the Core PCE (excluding food and energy) rose 2.8% year-over-year above an estimated 2.7%. The month-over-month measures of PCE and core PCE both increased by 0.3% and were in line with average projections of Wall Street economists. This report has provided some sort of relief for investors, despite being slightly higher on a year-over-year basis. For the Fed, however, it means that inflation has accelerated in the short term and the fight against rising prices is far from over. This is even more evident when looking at metrics such as core PCE on 3-month and 6-month annualized rates. These are still well above the Fed’s 2% inflation target (see the attached post and graph below).
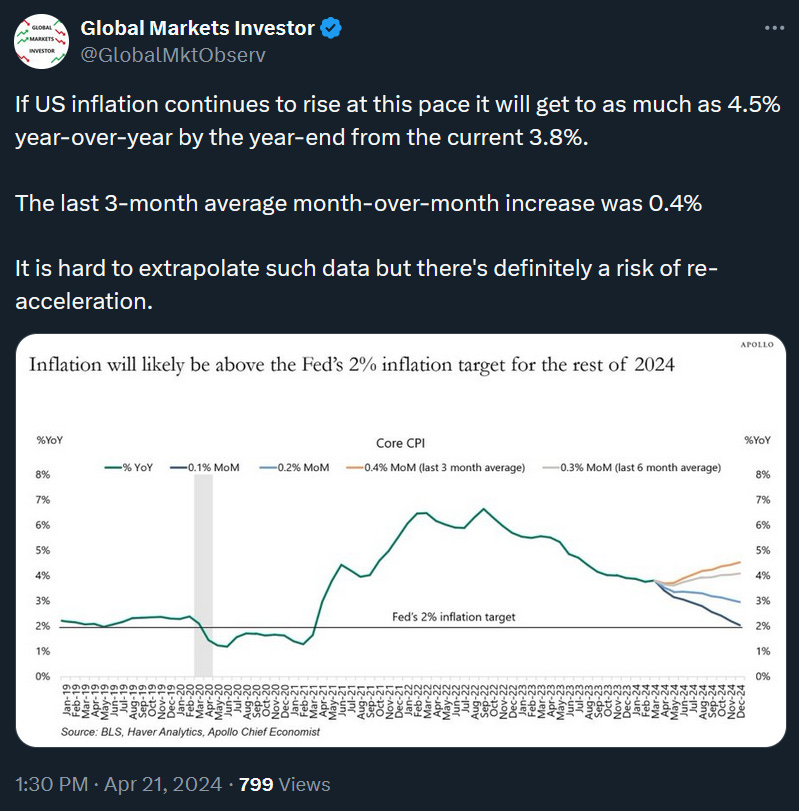
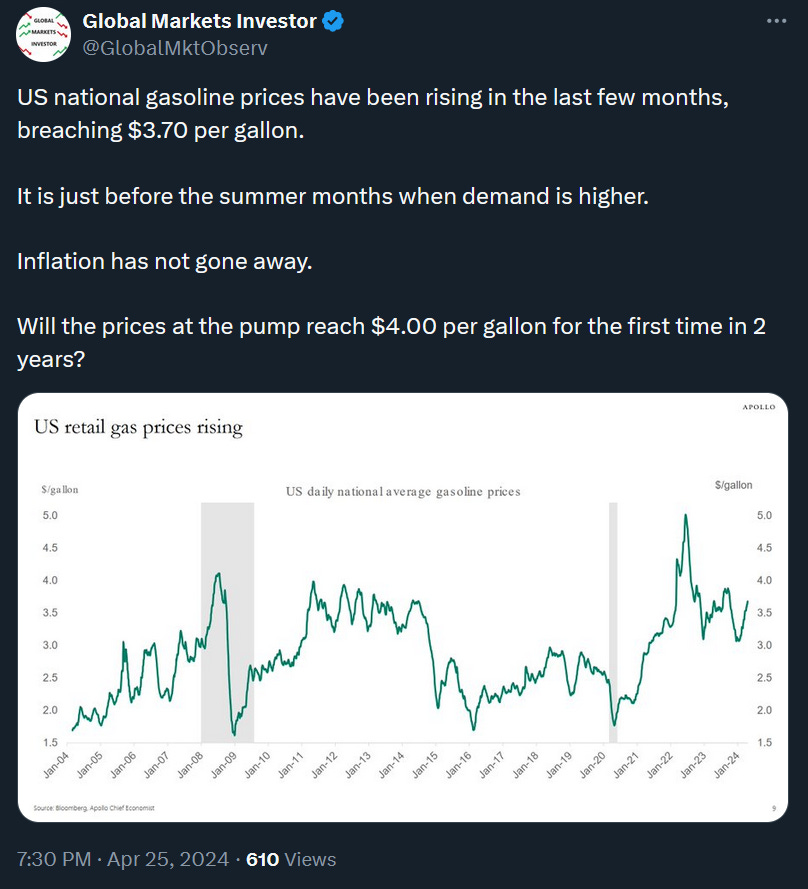
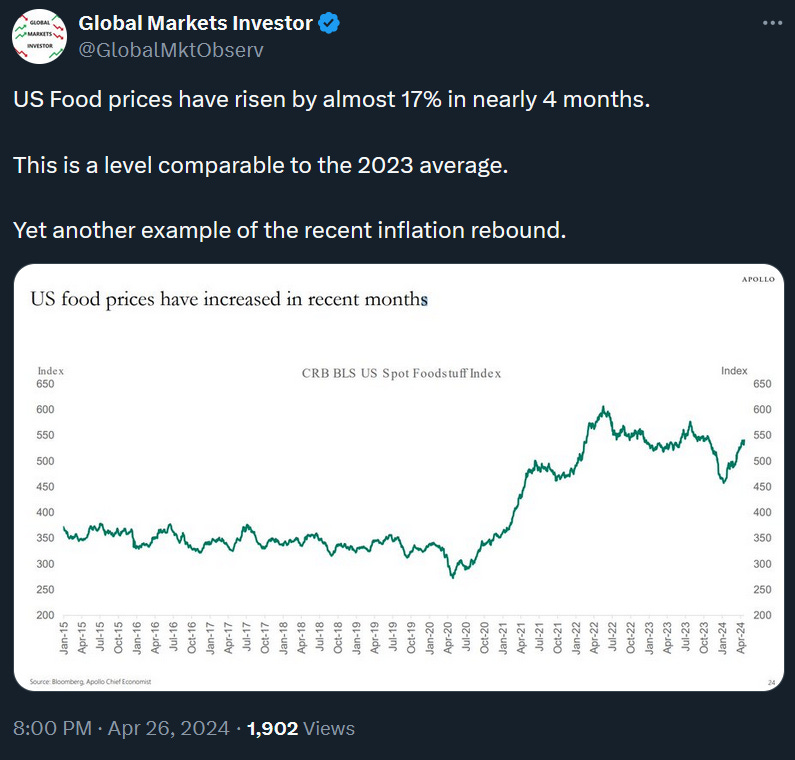
Besides that, you can find below some food for thought about the inflation methodology and a few posts showing that inflation has been really sticky in recent months.
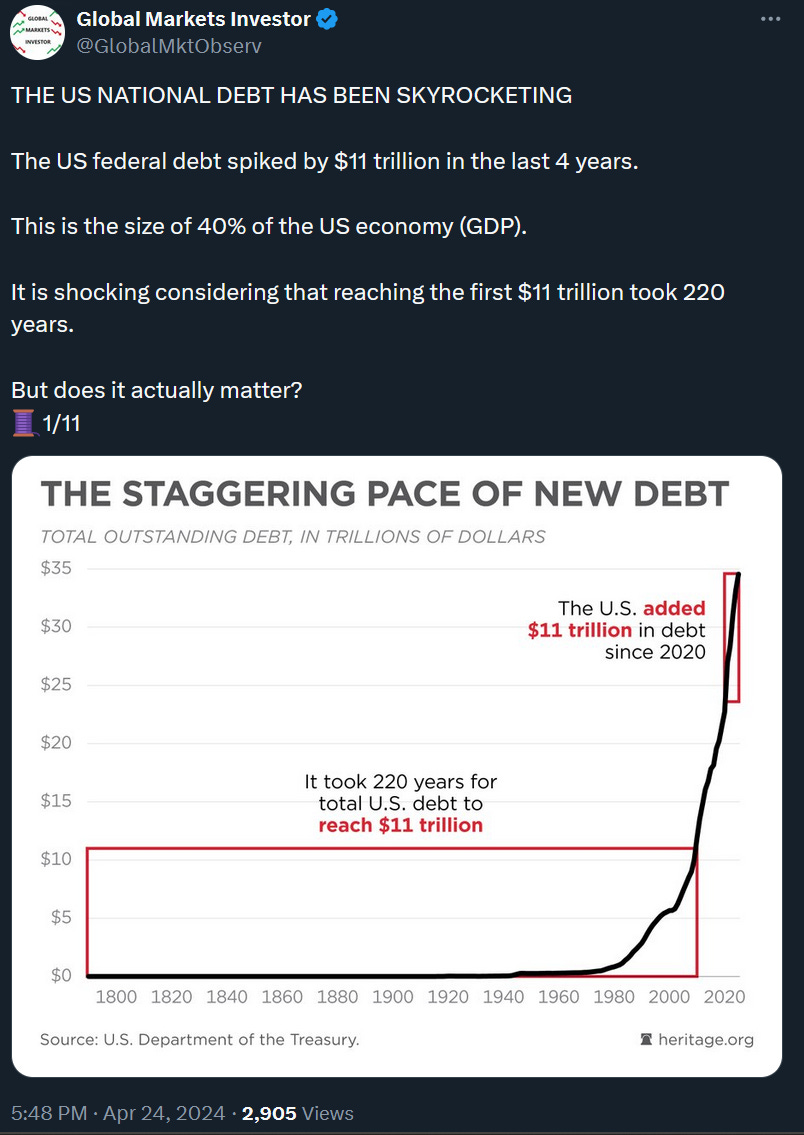
3) Another shocking statistic about the US debt. The US national debt has risen by $11 trillion over the last 4 years. By comparison, reaching the first $11 trillion of the federal debt took 220 years. If you are interested in what are the consequences of such ever-rising indebtedness you can read the below thread on X and the below article:
https://twitter.com/GlobalMktObserv/status/1783161059353780507
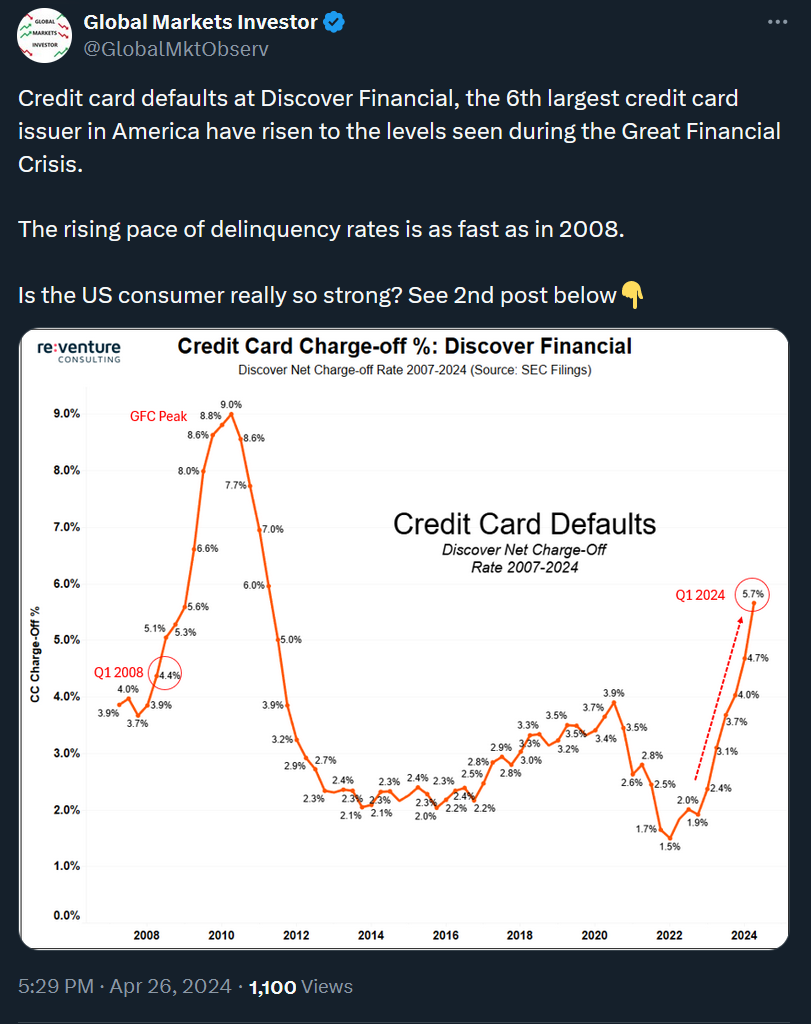
4) US consumers’ credit card defaults have been accelerating. Credit card defaults at Discover Financial, the 6th largest credit card issuer in America have risen to 5.7% in Q1 2024, the levels comparable to the ones seen during the Great Financial Crisis. This is another concerning data point in regard to one of the major engines of the US economy. How much dry powder do US consumers still have? You can find an answer in the below analysis:
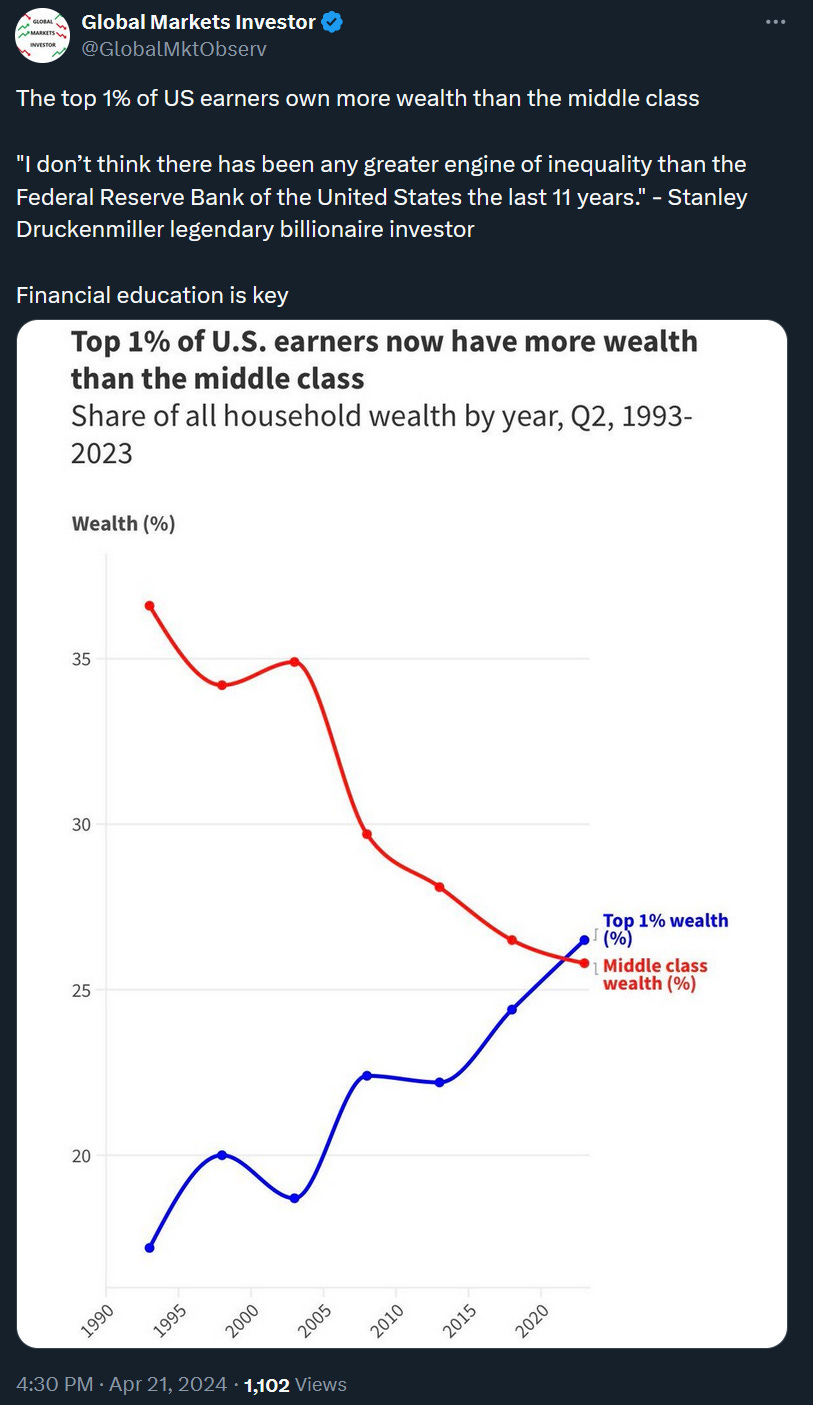
5) In the end something to chew on. The top 1% of US earners own more wealth than the middle class.
At this point, I’d like to THANK YOU again for getting more than 500 subscribers. I aim to improve financial literacy within society as more ordinary people have been struggling to make ends meet and losing their share in total wealth. As you can see, at the same time rich people have been getting richer at the fastest pace in history. This is the effect of skyrocketing financial assets value (stocks, real estate) over the last 15 years, among others. For that and many other reasons, financial education is key to being successful in life.
If you find it informative and helpful you may consider starting a premium subscription or buying me a coffee, and following me on Twitter:
Why subscribe?




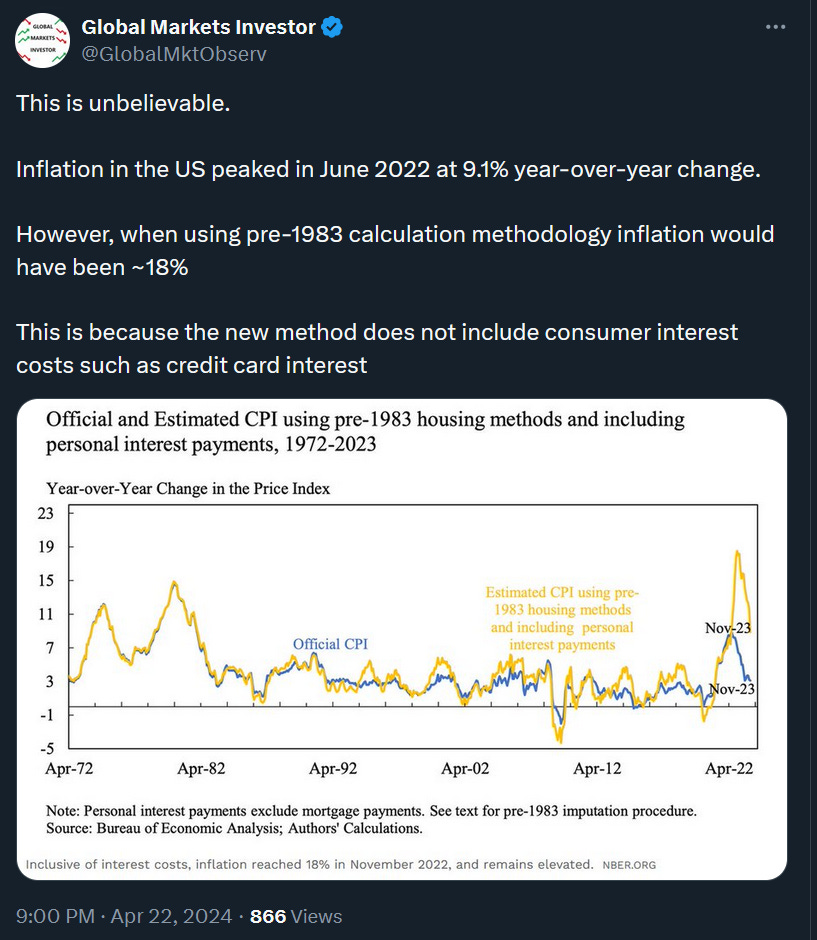
Using pre-1983 housing is a fast-shuffle. Here's why: in the major real estate markets, you can no longer buy a house or duplex and rent it out as an investment. Rents have not kept up with real estate prices, because real estate is artificially inflated: we destroyed unions, and pensions, and made real estate into a lottery ticket for a pension. Also, women started making real money and we juiced the market with double-income mortgages. So, the "owner-equivalent rent" trick is legitimate- I don't know how honestly it is used.
Credit-card rates are absolutely legitimate in this comparison. We freed up credit card rates from the old usury laws in the early 80s, and they have inflated since then. Plus payday loans, jeez.