Nvidia rallied 10% and became 2nd world's largest company. Weekly market recap, trading week 23/2024
Summary of the trading week in several posts with the most interactions on X
In this series, I’ve been bringing out financial posts with the largest number of interactions from my feed on the X platform over the most recent week. I am aware that not everybody uses X regularly so I thought it could provide some value to your analysis, and investment process.
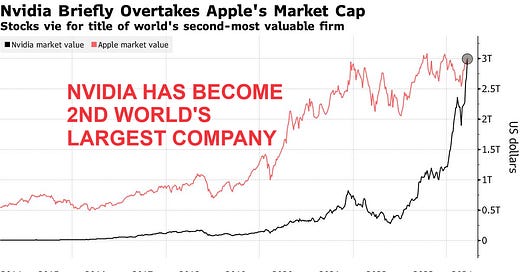
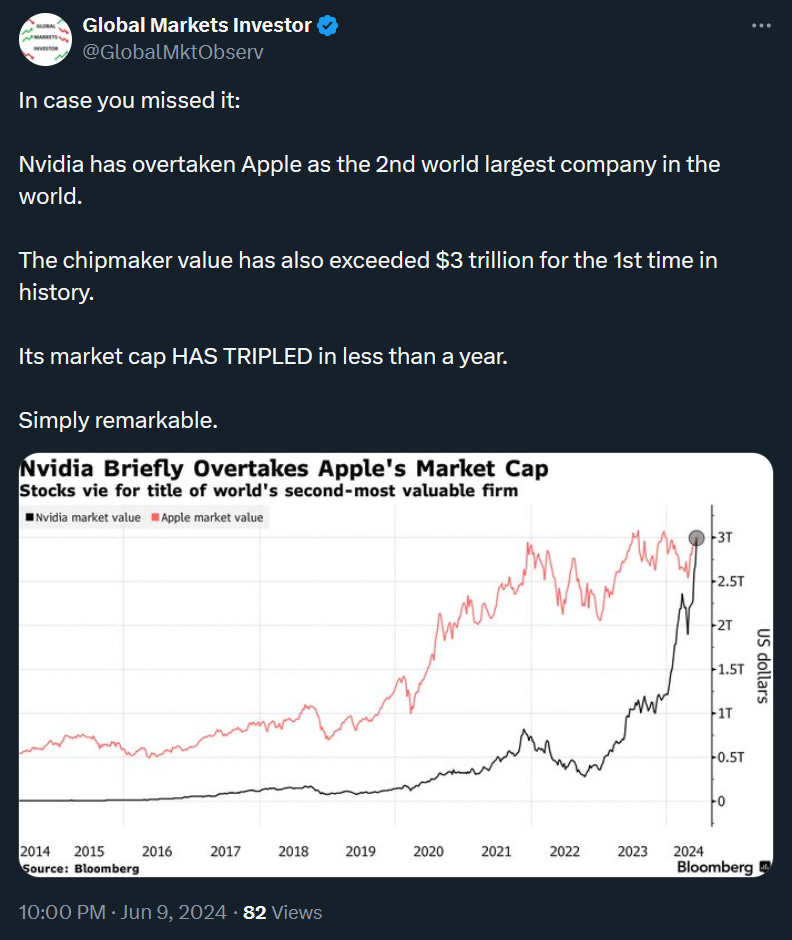
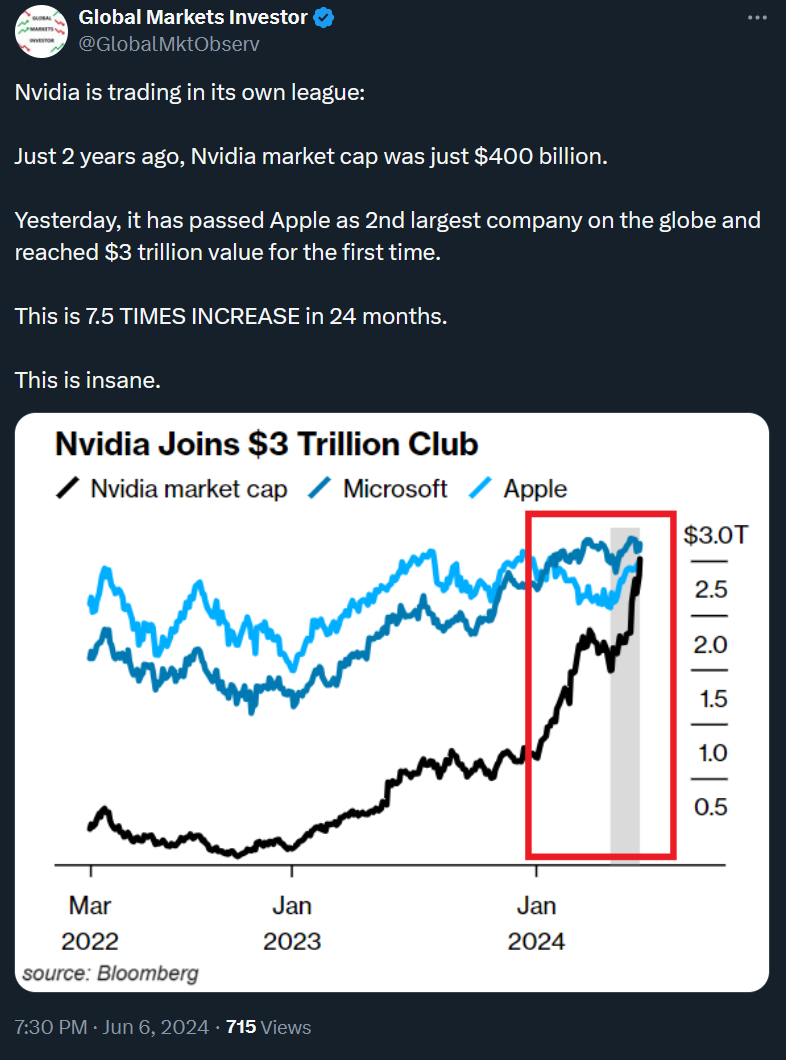
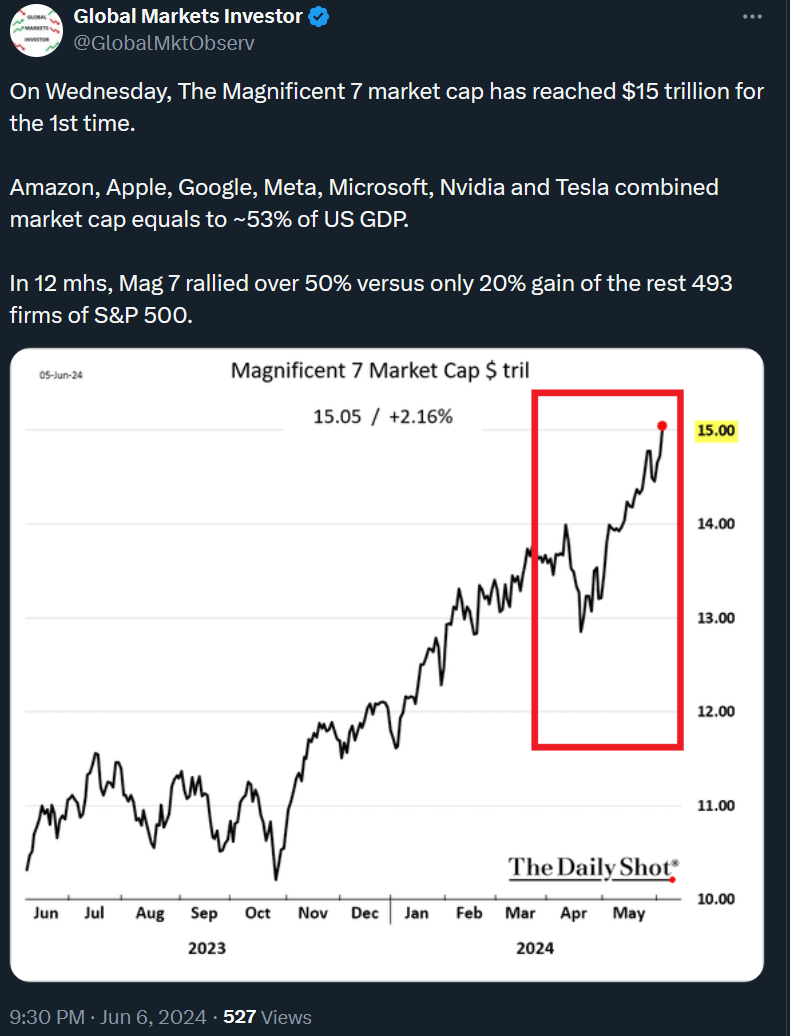
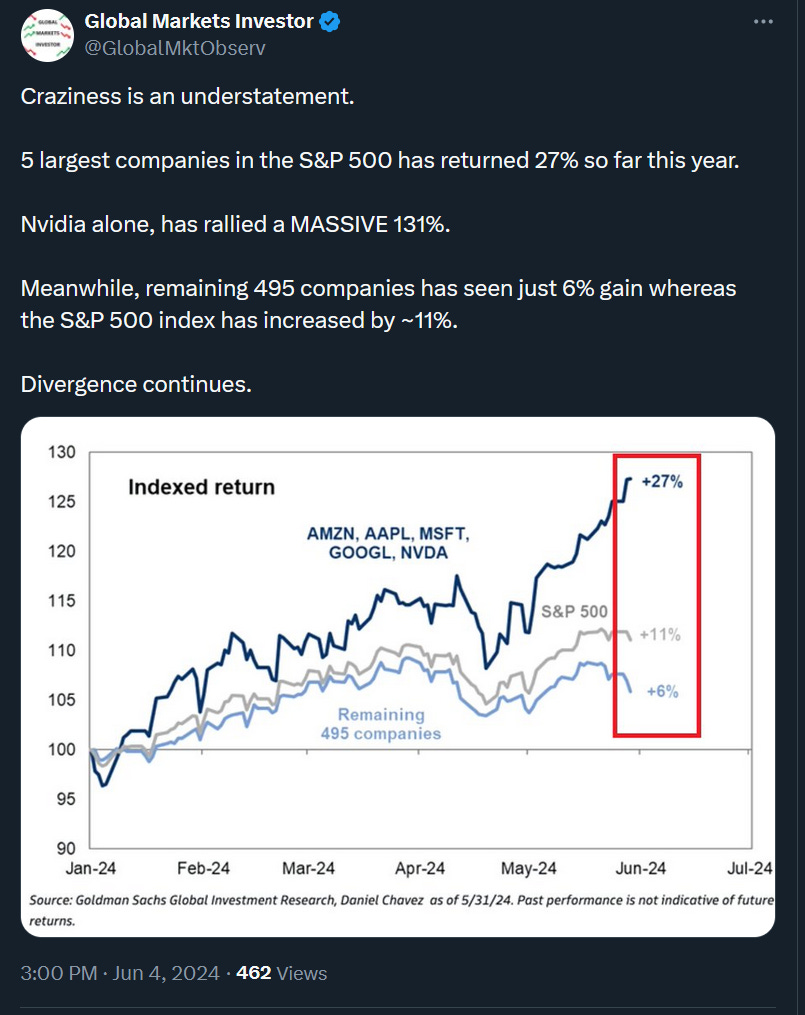
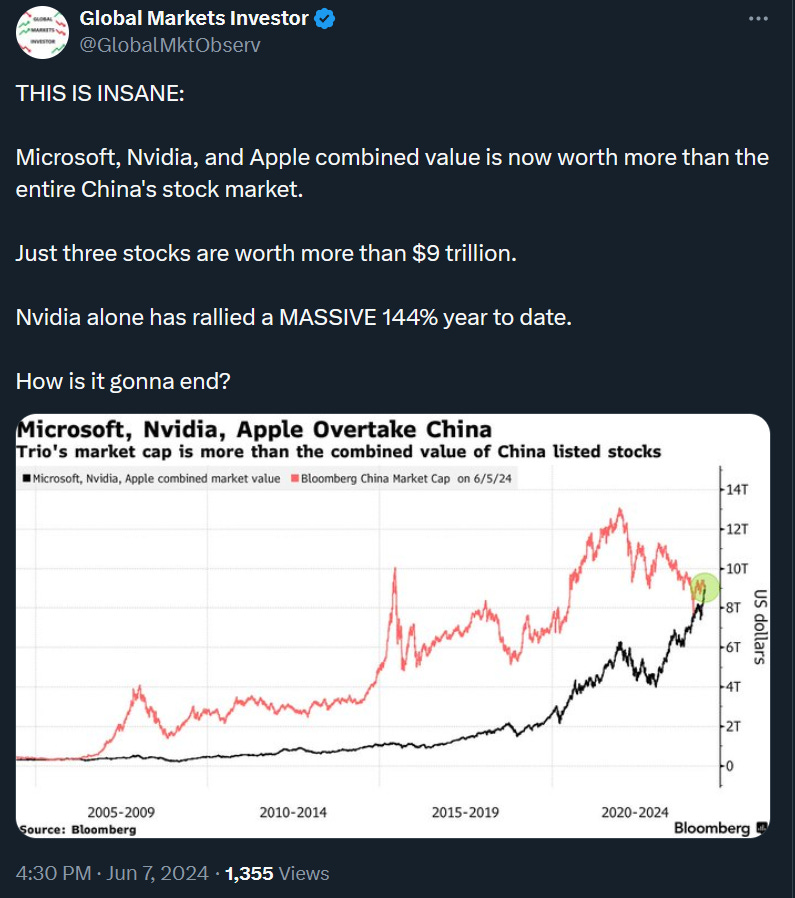
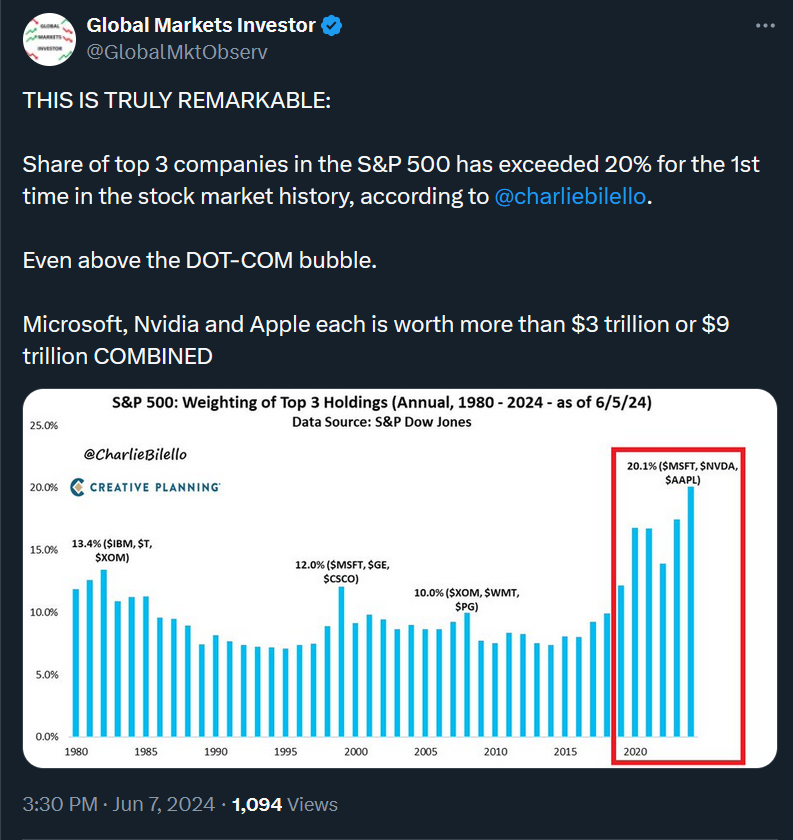
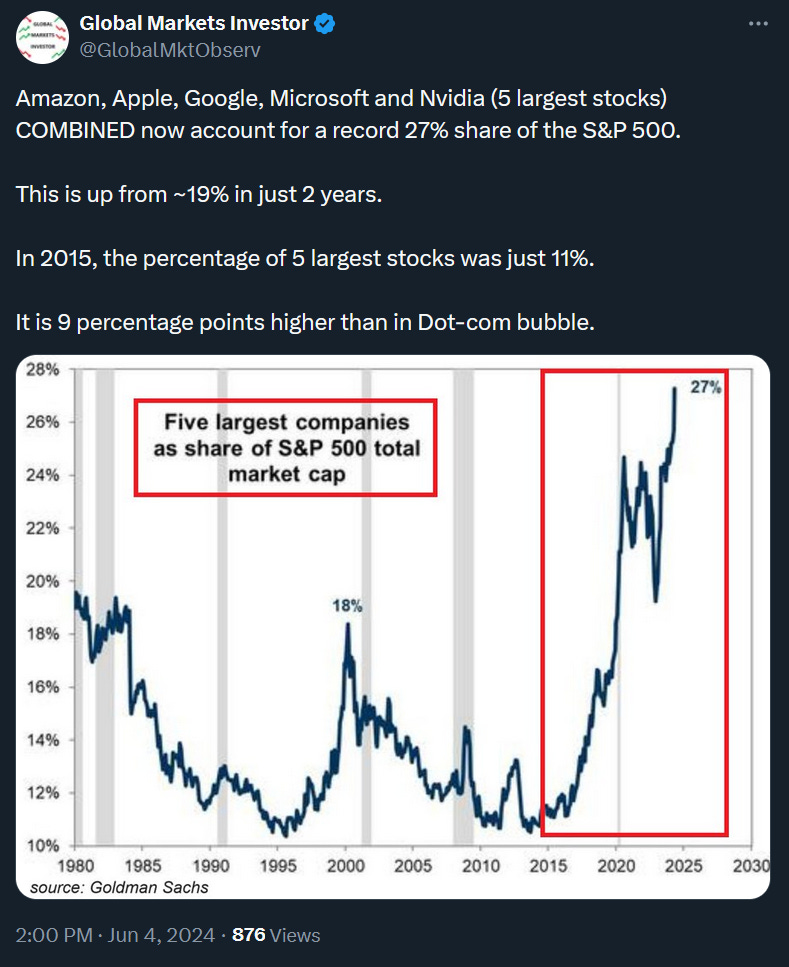
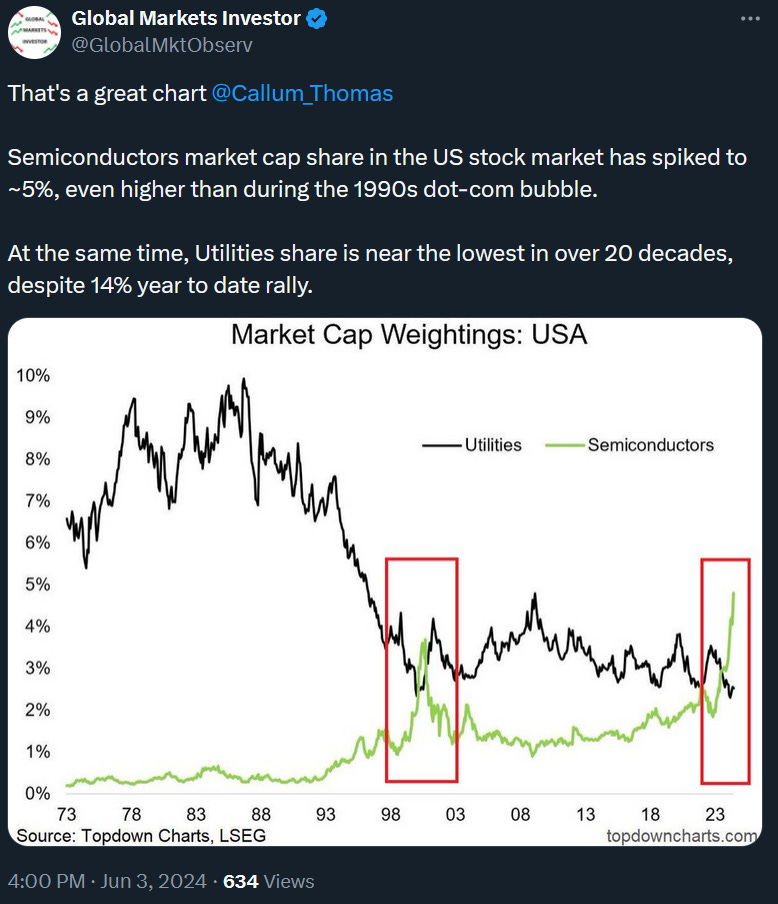
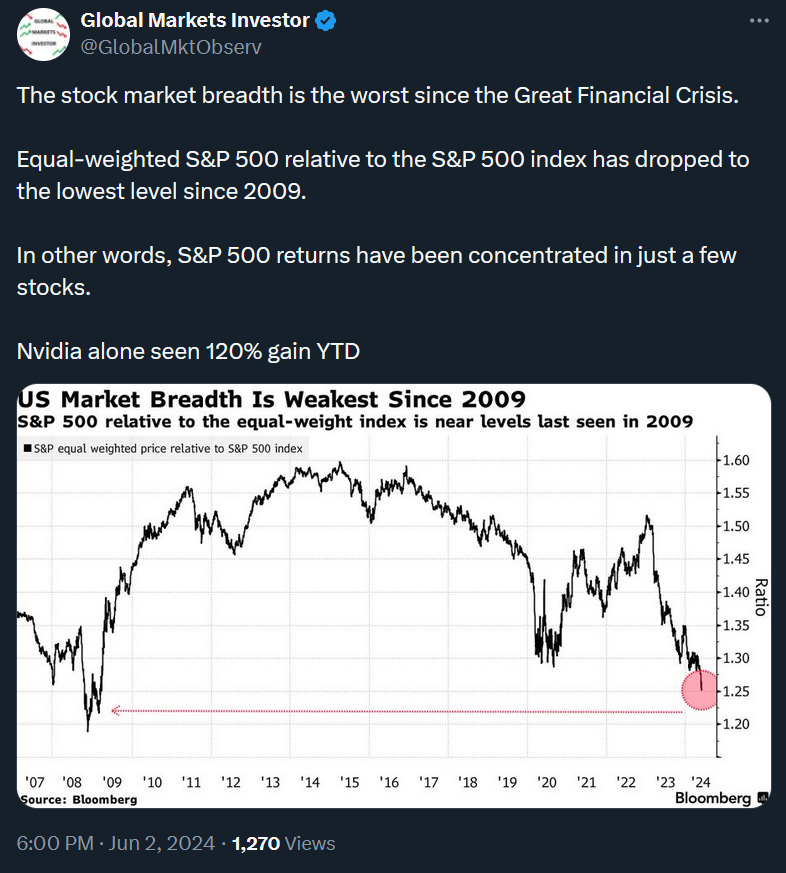
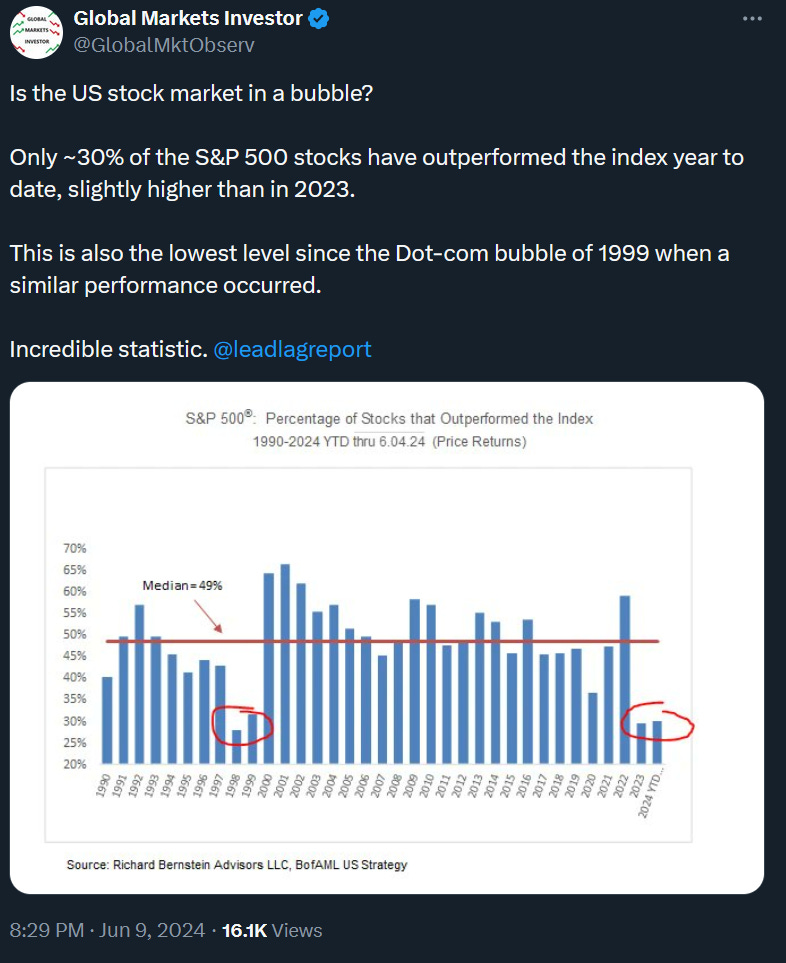
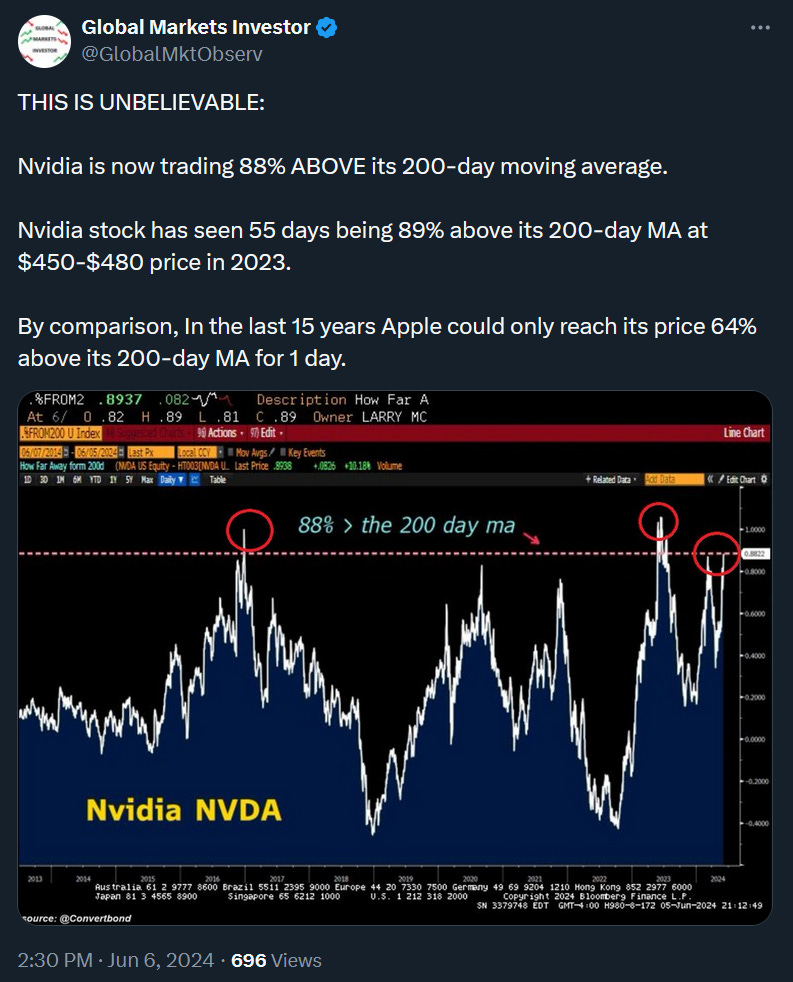
Markets have experienced another crazy week. The S&P 500 saw its 25th all-time high this year while Nvidia rallied 10% and became 2nd world's largest company surpassing Apple. Nvidia has also accounted for ~50% year-to-date gain in S&P 500 market capitalization. What are the risks associated with such a phenomenon? Read the full piece below:
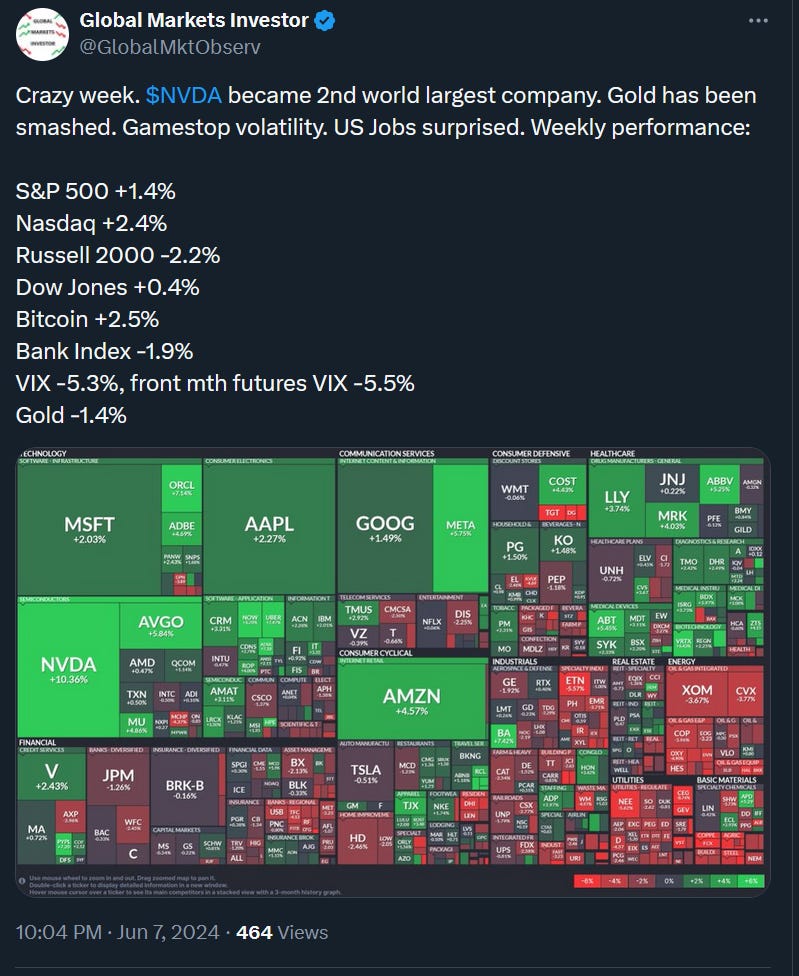
1) Weekly performance. In the first screenshot attached, you can see last week’s performance of the major US indexes, the VIX volatility index, gold, and Bitcoin.
- S&P 500 ended the week up 1.4% despite Friday’s 0.2% decline related to strong US job market data - in the headlines. Interestingly, this was 6th week of gains out of the last 7.
- Nasdaq 100 index was notably up 2.4% driven by Nvidia, Meta, and Amazon.
- Dow Jones was up 0.4%.
- Russell 2000 (small caps) substantially underperformed and saw a 2.2% drop.
- VIX was down over 5%.
- Gold was smashed on Friday by over 3% and was down 1.4% for the week due to rising US government bond yields.
- Bitcoin saw a 2.5% gain.
For the trading week ending June, 14 key events are:
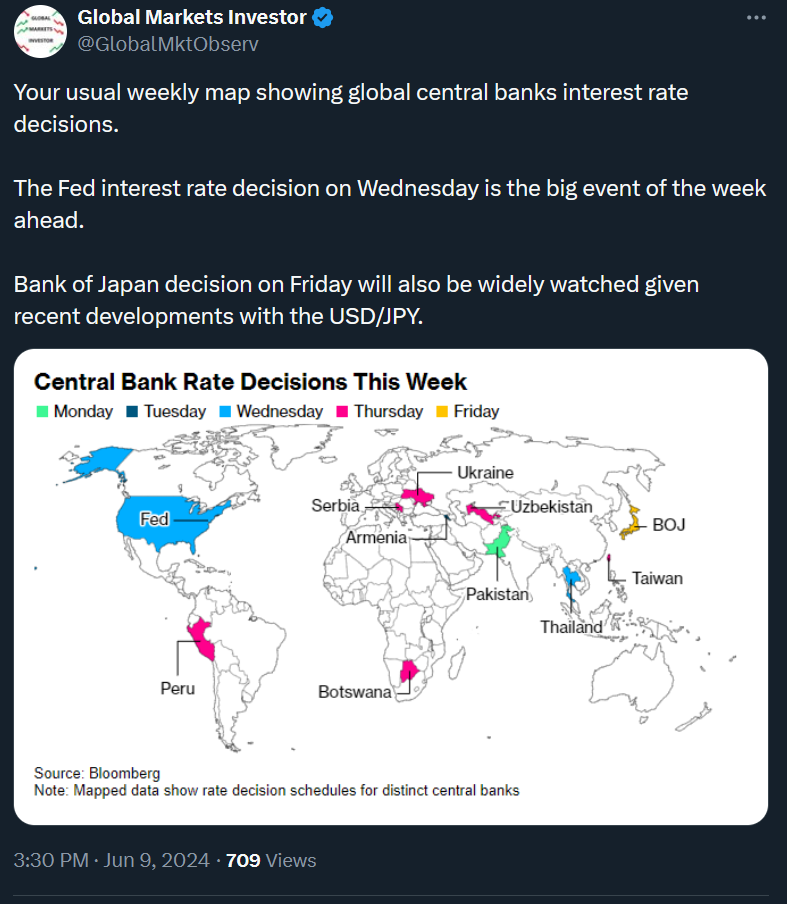
- Fed interest rate decision including dot-plot projections and Chair Jerome Powell’s conference on Wednesday
- US CPI Inflation data on Wednesday
- US PPI Inflation data on Thursday
- US Michigan consumer sentiment data on Friday
The Fed meeting will be the most important event this week with all eyes on Chair Powell’s guidance as well as the Fed’s dot plot update after March. The market currently expects 1-2 rate cuts for 2024 and economists now expect the Fed to tweak the dot-plot from 3 to 2 cuts.
More details about the Fed’s last (March) dot-plot projections are below:
2) In April, the US saw 2nd largest number of bankruptcies in 46 months!

