


🚨November job market report is worse than many think
Please find the job market breakdown of the world's largest economy

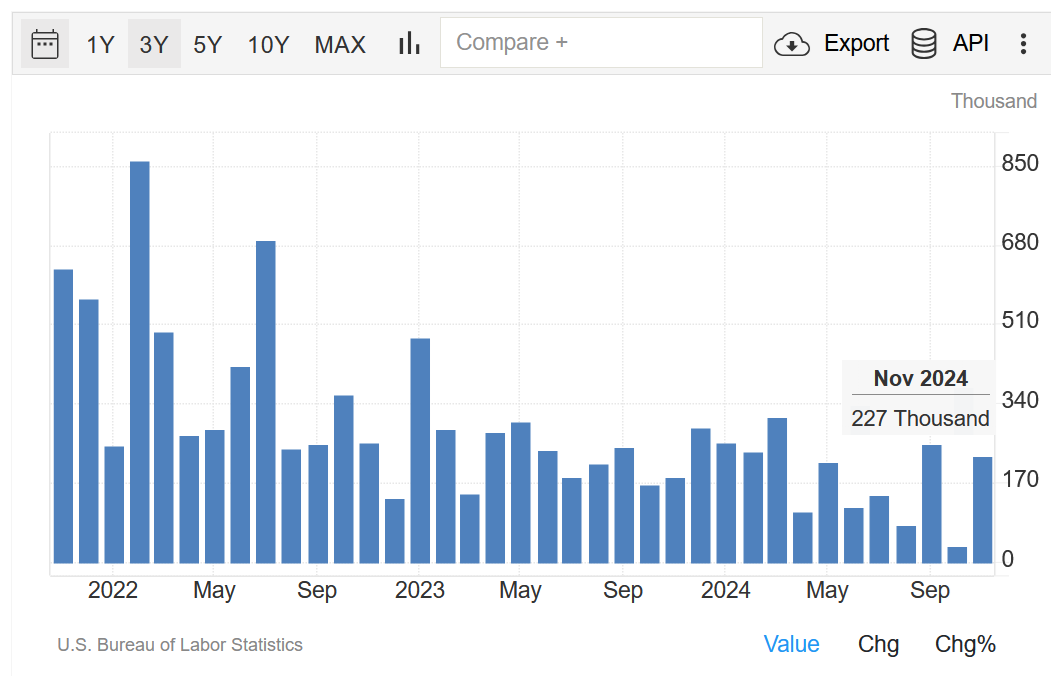
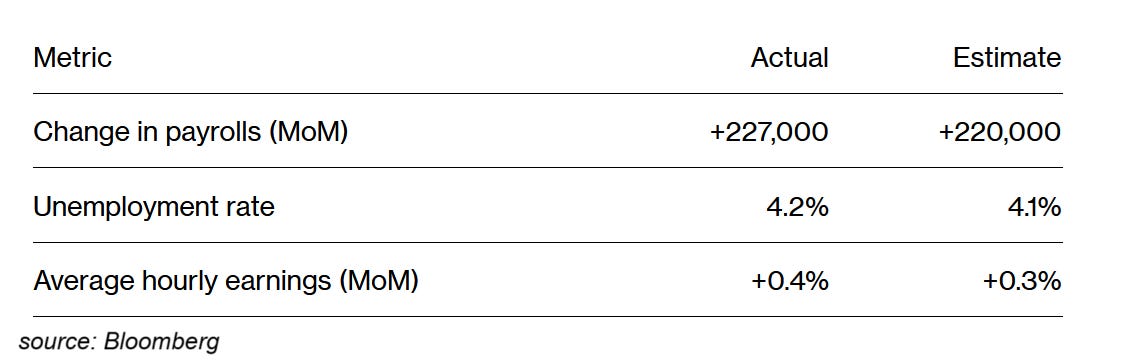
The Bureau of Labor Statistics (BLS) estimates the US economy created 227,000 jobs in November, according to a job report released Friday, 6th of December. This was slightly above Wall Street’s expectations of 220,000 jobs addition. The unemployment rate rose to 4.2%, also above forecasts.
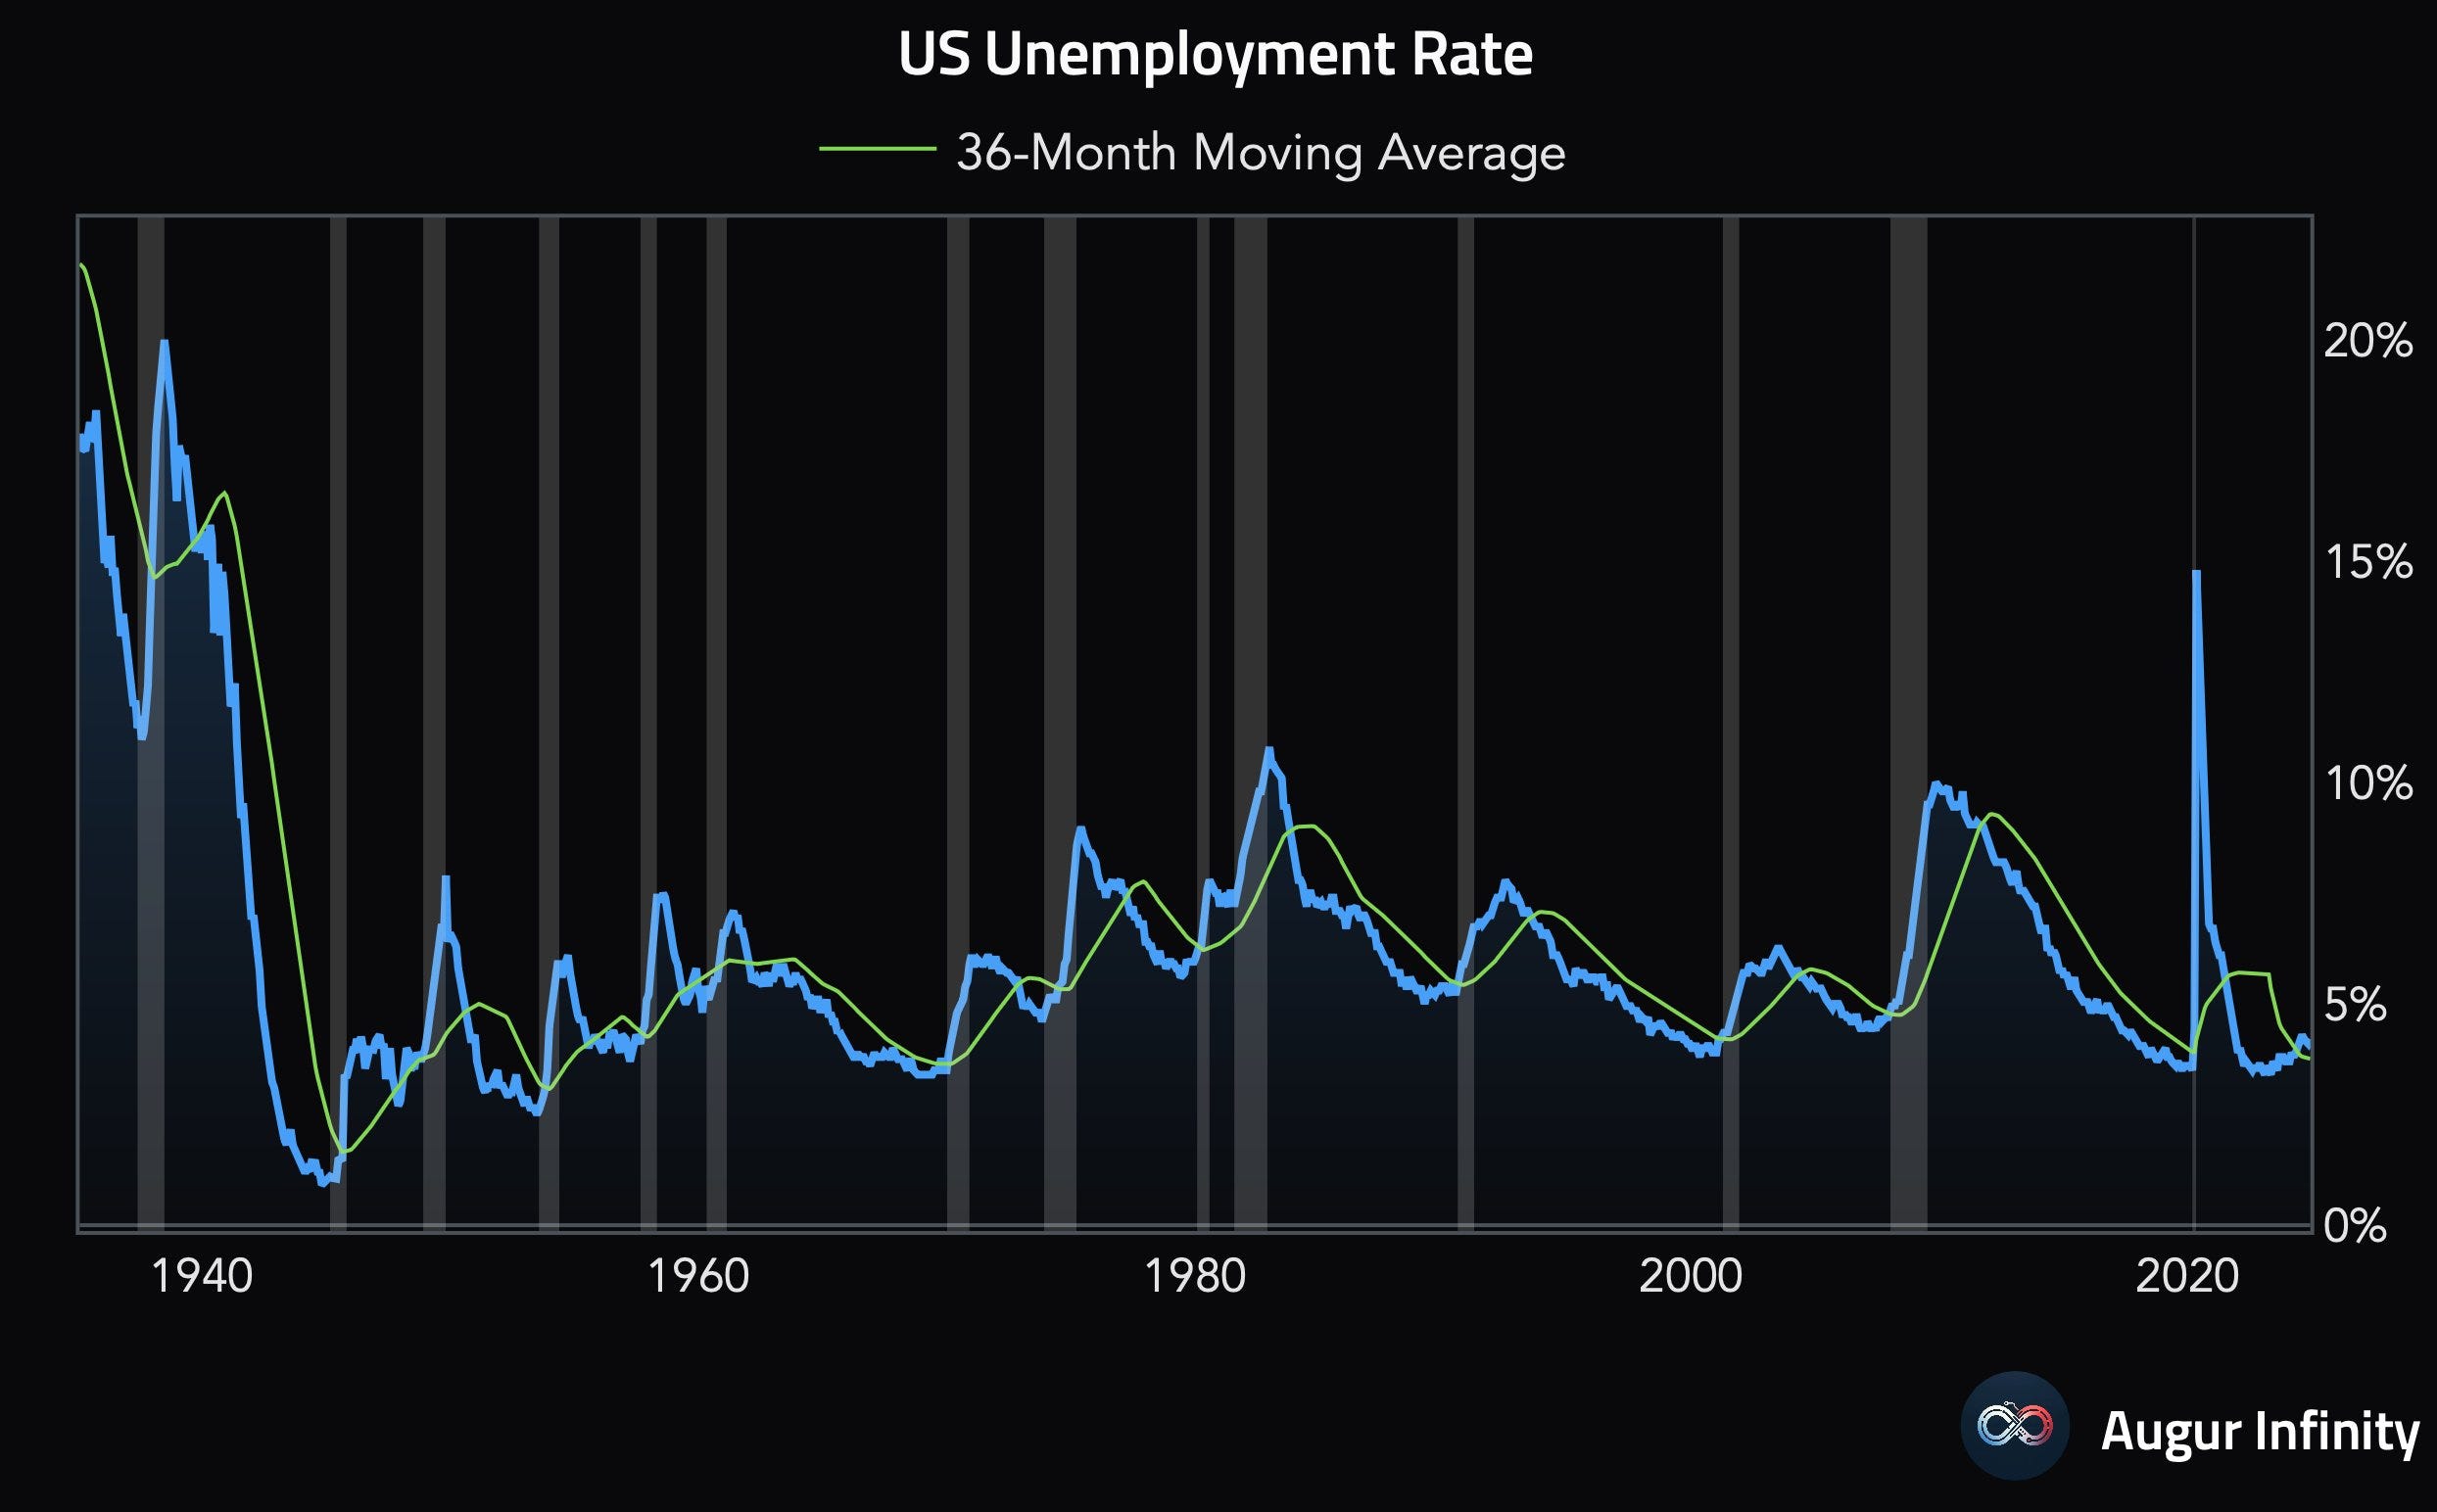
In fact, the jobless rate increased to 4.246% unrounded, just below the cycle high of 4.253% seen in July and it remains above its 36-month moving average.
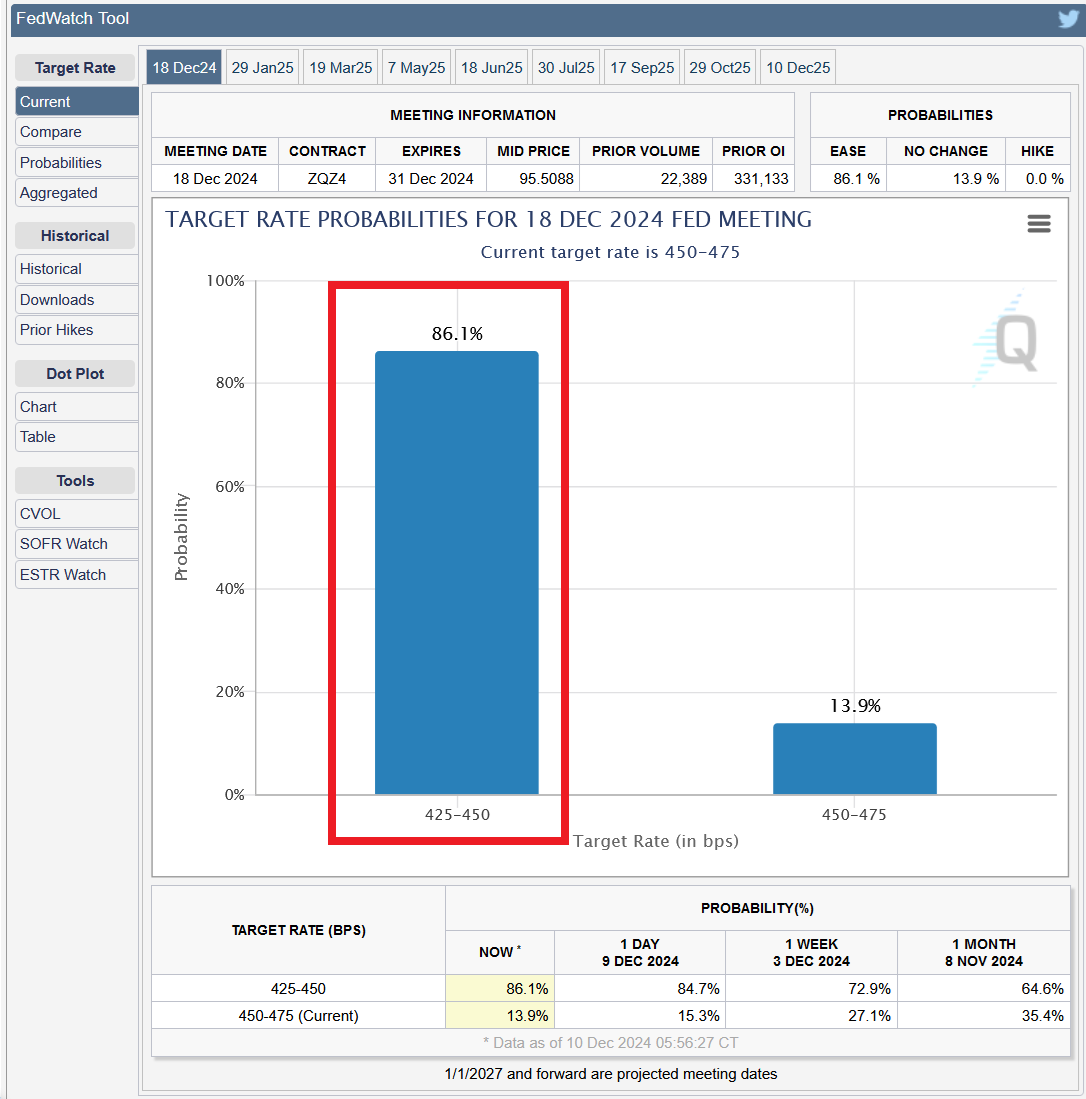
Interestingly, following the data release the market started pricing in a higher chance of a 0.25% rate cut by the Fed at the next meeting scheduled for December 18 suggesting the report is not as good as media headlines claim. The market is pricing an 86% probability of a 0.25% reduction, up from 73% last week.
As usual, in the following sections, we dig into the details of the report and explain the real picture of the labor market.


ESTIMATED REVISIONS POINT TO NEGATIVE JOB GROWTH IN SOME MONTHS IN 2024
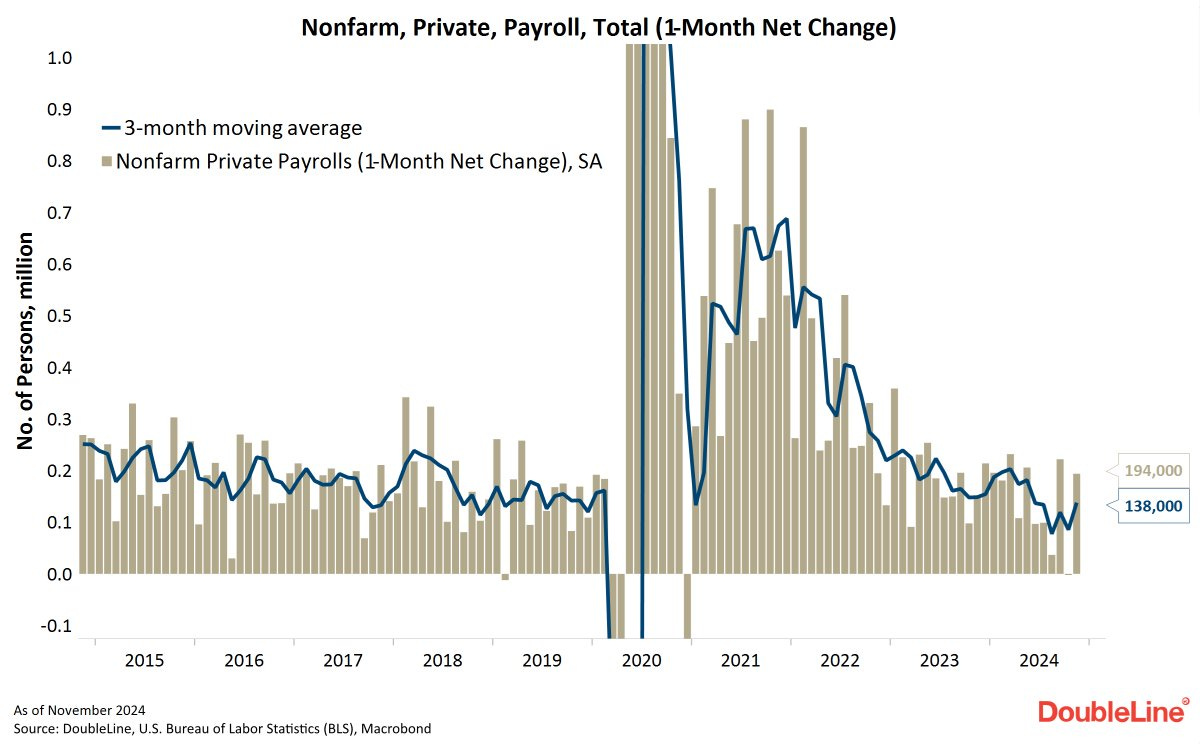
Out of the 227,000 jobs allegedly created last month 194,000 were in the private sector, one of the largest readings this year, while the rest were in the government sector. We have to keep in mind, however, that we need to wait 2 months to see initial revisions to this data.
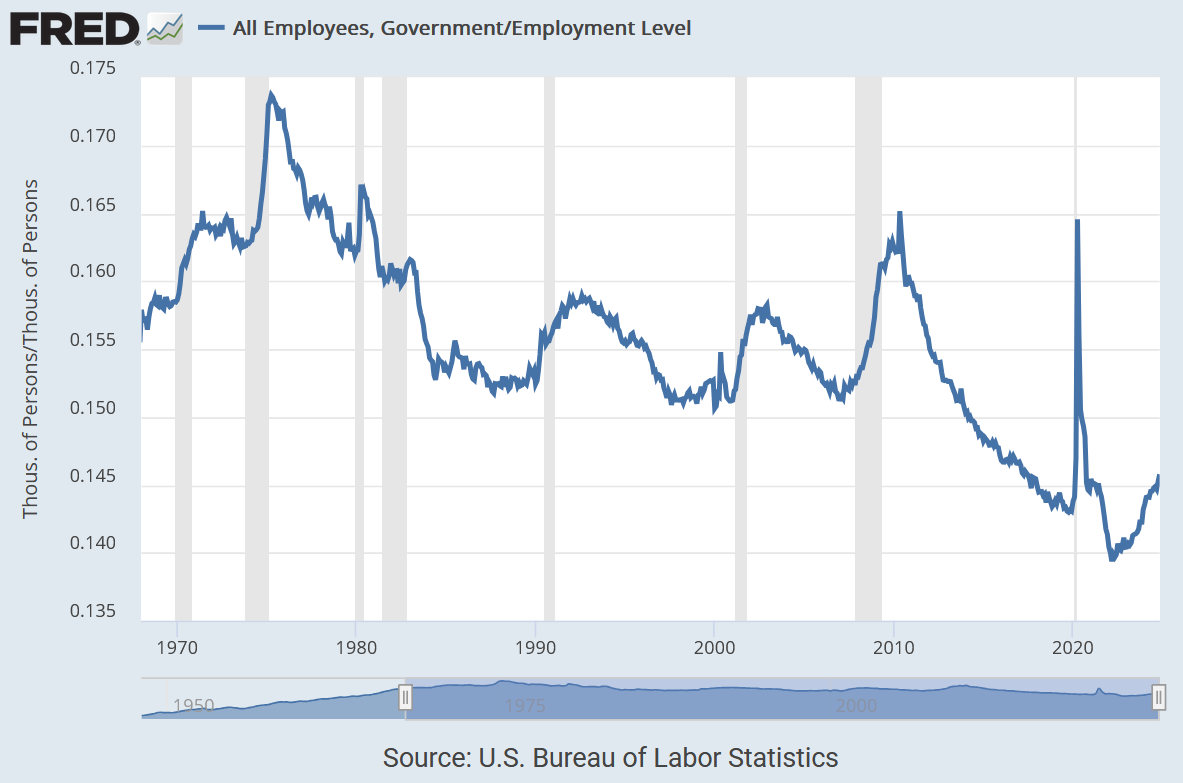
Before moving to revisions let’s touch upon government jobs data. As mentioned last month, the government job creation has been unusually elevated.
Arkomina research found that since January 2023, the government has added 1.12 million jobs, the 4th largest streak on record since 1939, and only below one month in 2000, 22 months in 1966-1968 (Vietnam War) and 21 months from 1941-1942 (World War II). This is incredible.
As the chart below presents, the ratio of government jobs to the total employment level usually rises during recessions or at least significant economic slowdowns.
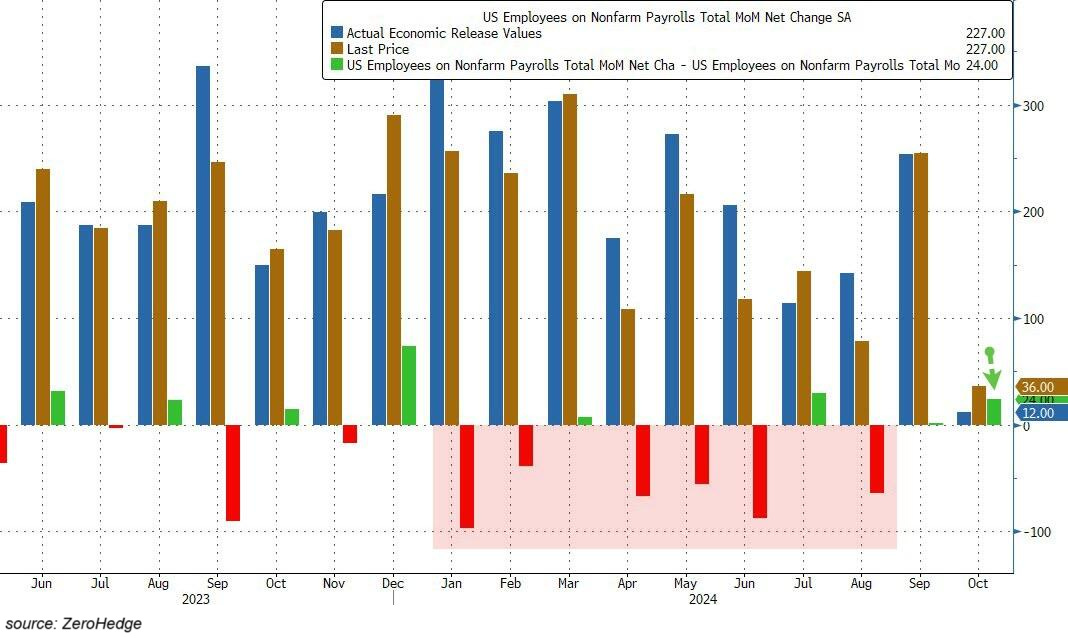
Switching gears to revisions we learn that employment in September and October combined has been revised higher by 56,000. However, it does not really matter now.
What matters are subsquent revisions from the Quarterly Census of Employment and Wages (QCEW) data provided by the BLS that cover 95% of all US jobs. More on this in the below piece:
According to the QCEW released a few weeks ago, nonfarm payrolls will likely be revised downward by another ~300,000 jobs for 2Q 2024. What is even more staggering is if this trend continues, it will turn out that both August and October jobs actually dropped by ~10,000 and 80,000, respectively instead of growing.
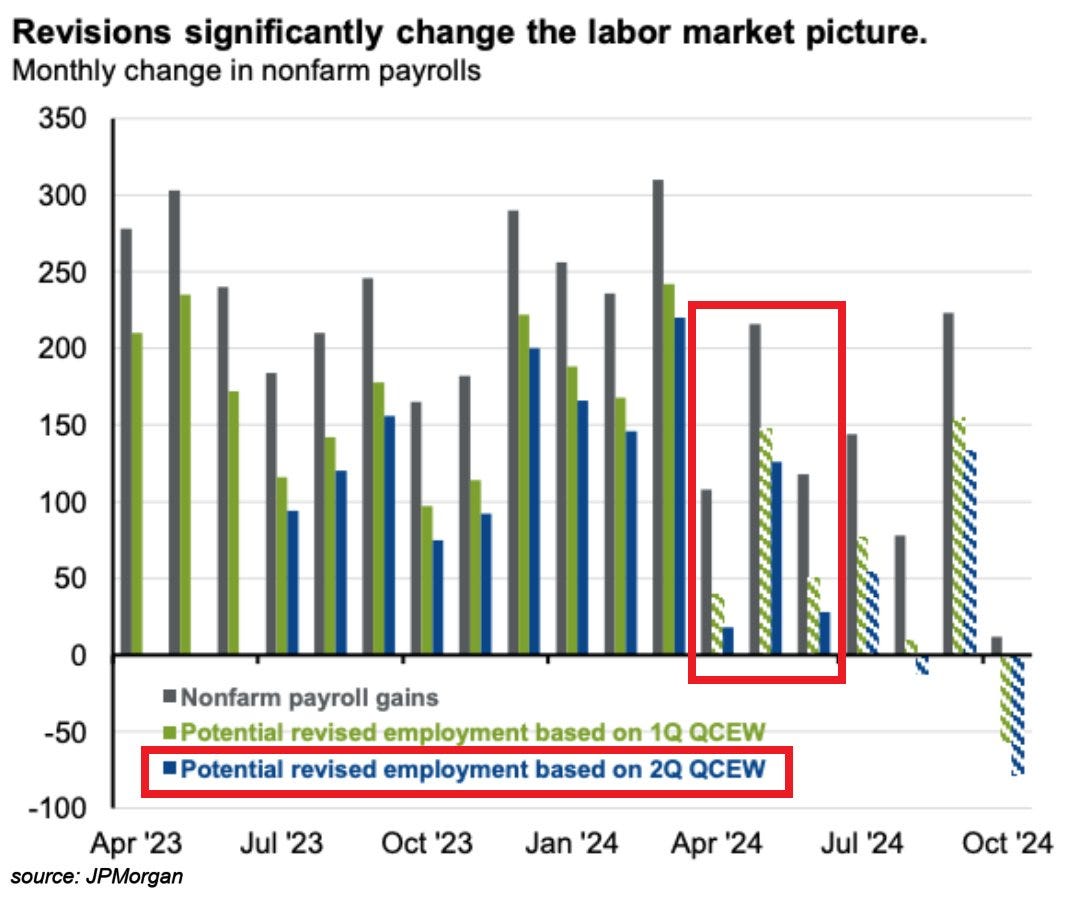
To sum up, significant downward revisions are expected to continue. Because of that it is difficult to derive any meaningful conclusions based on the above data.
Therefore, it is better to analyze the household survey - the data from which the unemployment rate is derived. As a reminder, this survey is based on 60,000 households (but will be cut down to 55,000 from 2025).
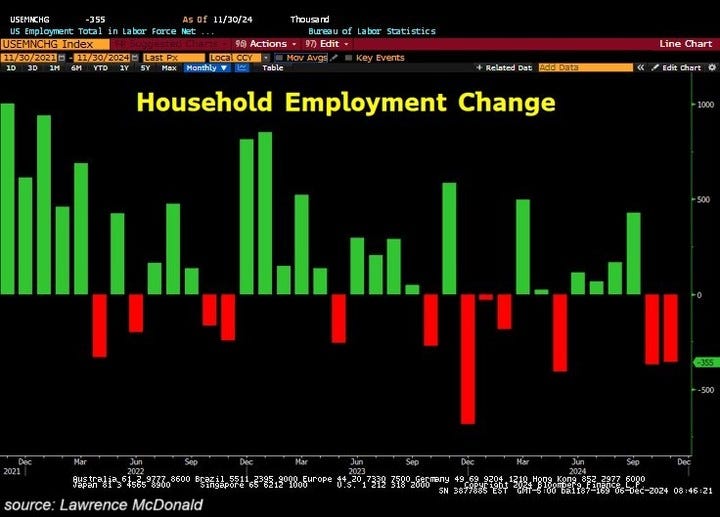
Based on the survey we can see that a whopping 355,000 and 368,000 Americans lost jobs in November and October, respectively. In November alone, full-time jobs fell by 111,000 and part-time jobs by 268,000.
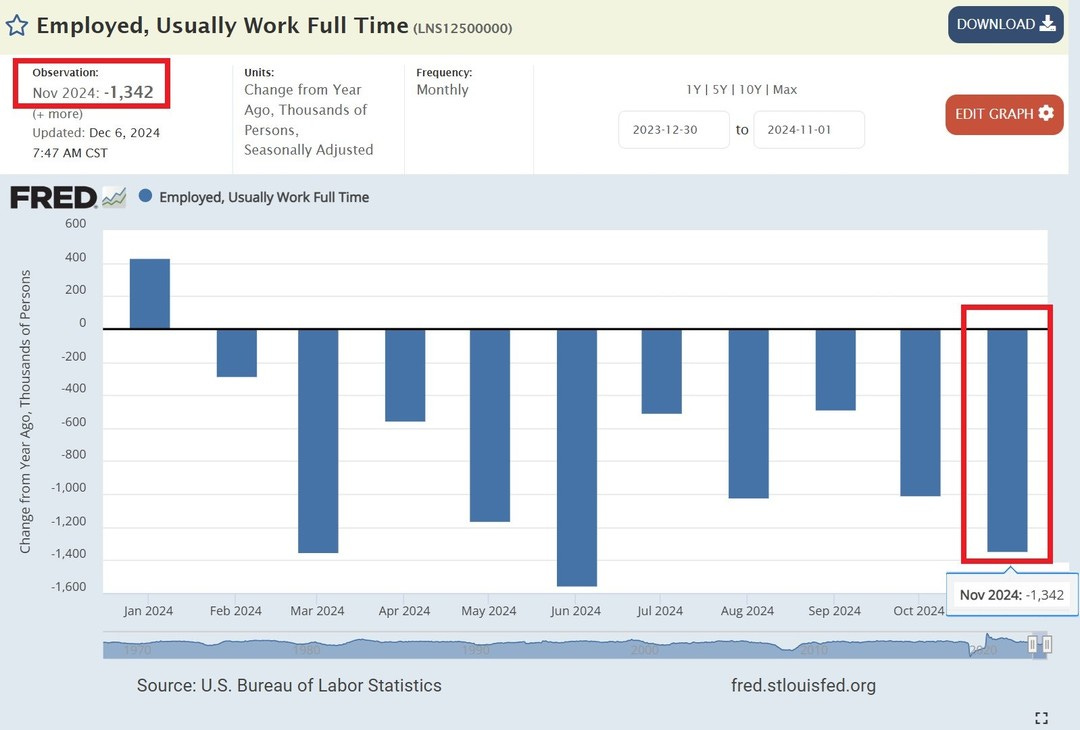
Year-over-year, the economy shed 1.34 million full-time jobs in November. As you can see on the graph, full-time jobs have now fallen year-over-year for 10 months straight.
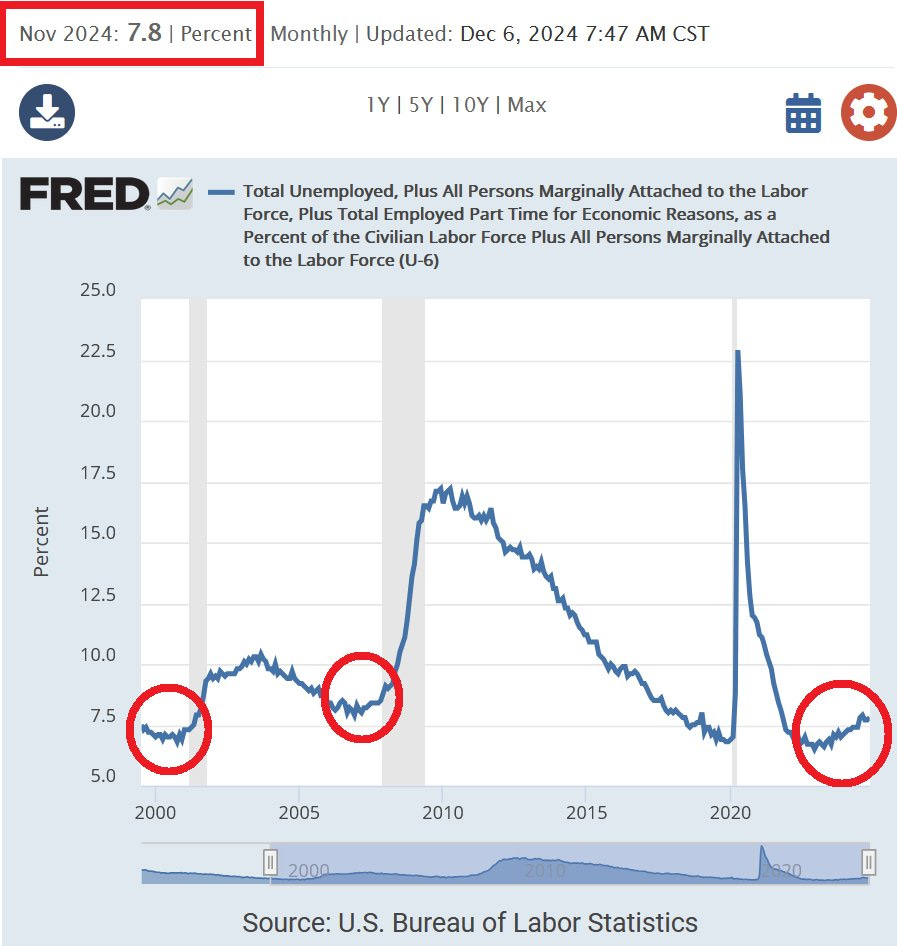
As a consequence, the U-6 unemployment rate rose to 7.8% in November, the 2nd-highest level in 3 years. It has now surged by 1.3 percentage points over the last 2 years. This metric includes Americans who want to work but have given up searching and part-time workers who cannot find full-time jobs. This is a wider measure than the regular unemployment rate.
This is an initial analysis of what has been reported in the November job market report. As you can see, the picture is not as great as the media headlines claim. To understand what exactly is happening, we need to dig further into the data.
ADDITIONAL JOB MARKET DATA POINTS TO FURTHER RISE IN THE UNEMPLOYMENT RATE
All referenced metrics below point to only one conclusion. The US is in a recession or on the brink of one.
The number of permanent job losers soared by 304,000 in November to 1.9 million, the highest level in 3 years. These are people who have been let go or laid off permanently from a particular position and are looking for work.

Permanent job loss has now risen for 21 consecutive months, the longest streak since the Great Financial Crisis.
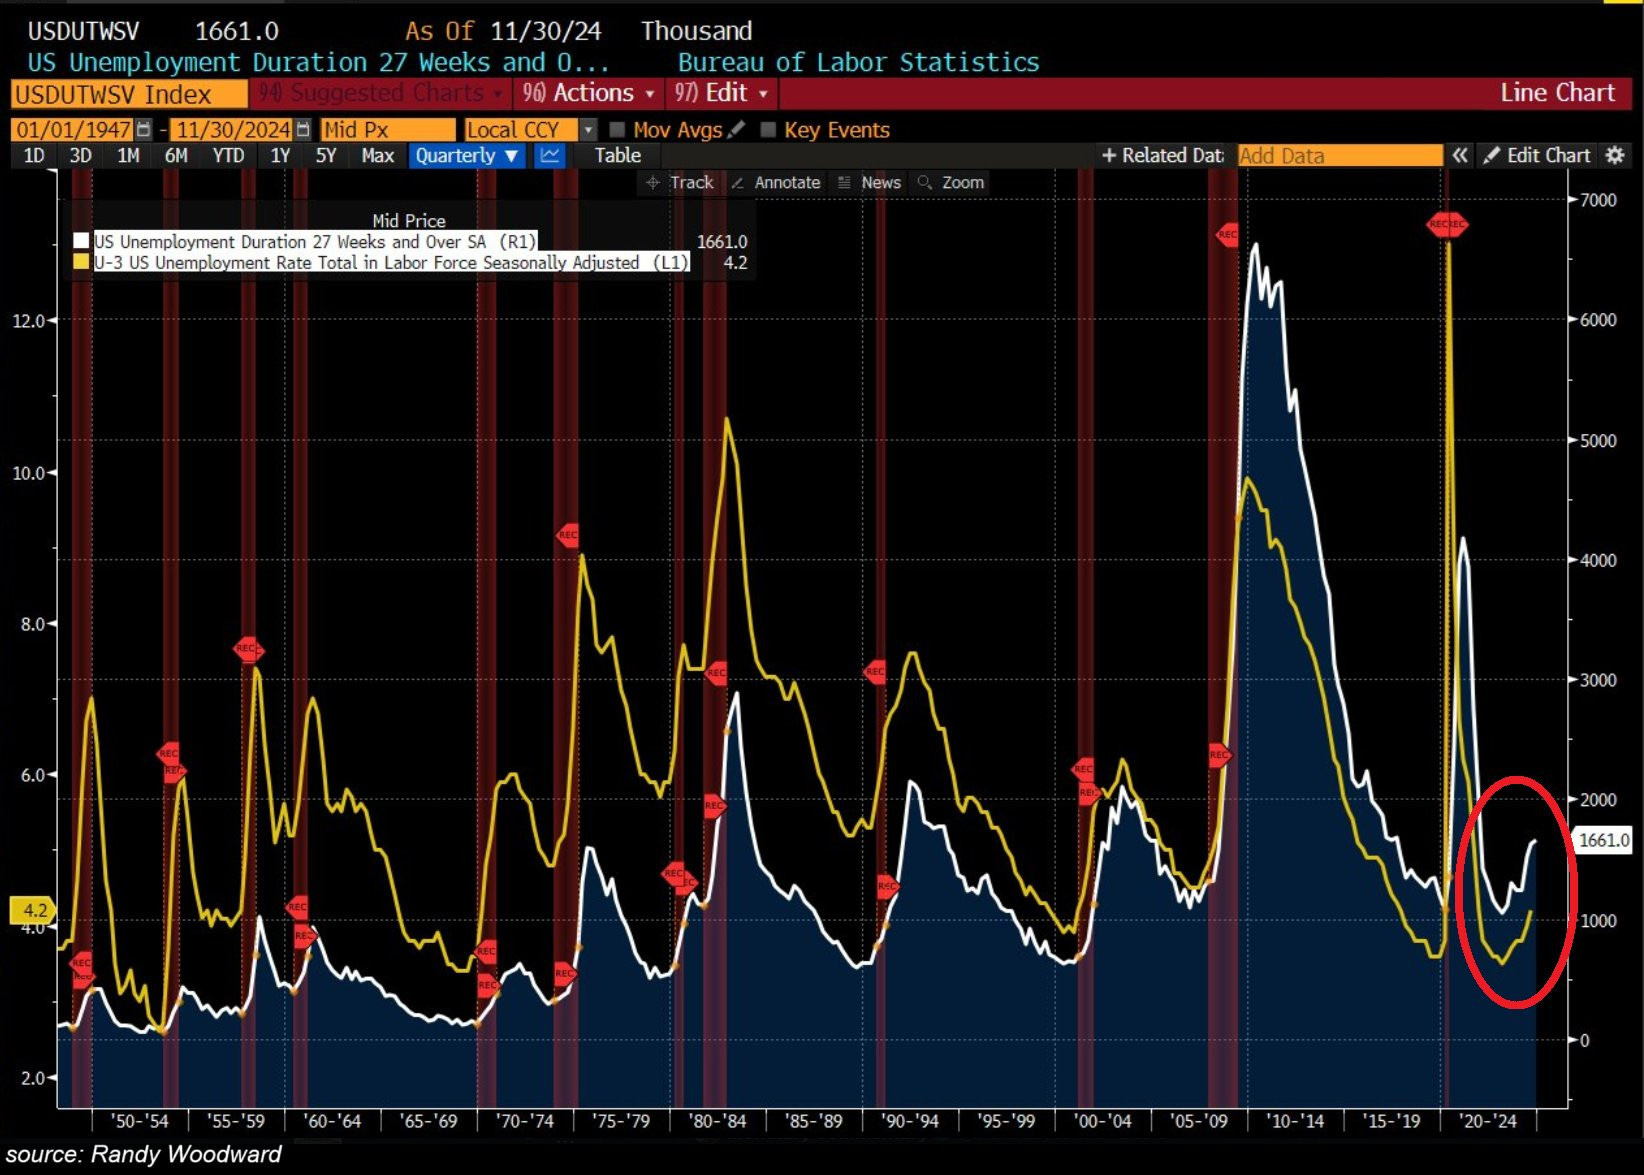
Moreover, the number of unemployed Americans for 27 weeks & over (long-term unemployment) hit 1.66 million in November, near the highest in 3 years. As a percentage of total unemployed, this metric jumped to 23.9%.
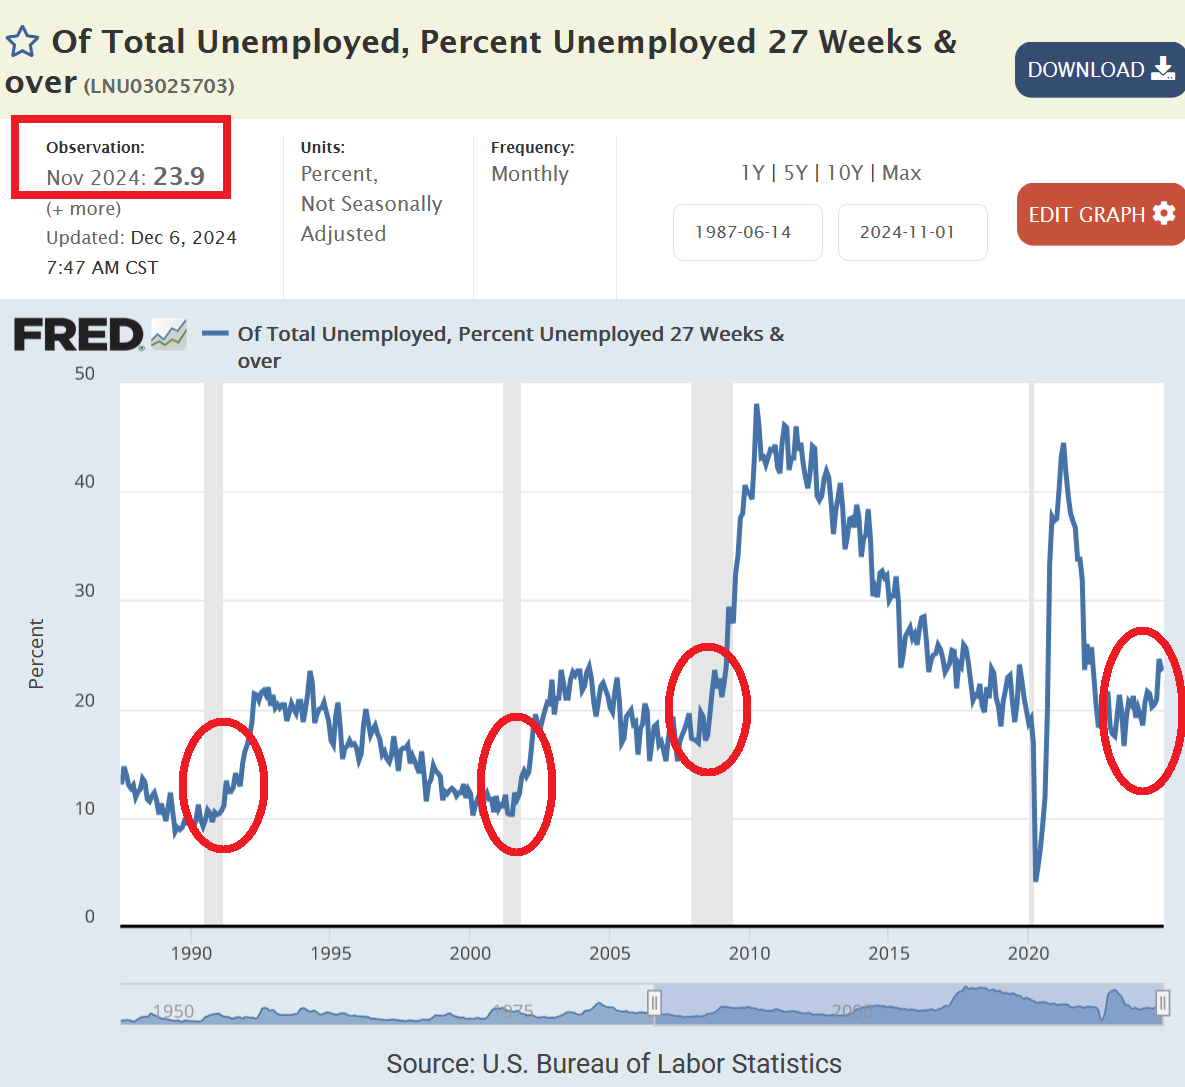
In the previous economic cycles, this was a leading indicator of the unemployment rate. This gauge suggests the jobless rate will continue rising in the coming months to at least 5%.
Lastly, the ratio between Americans transitioning from unemployment to employment relative to the hiring rate fell to the lowest since 2020. In other words, fewer and fewer unemployed people are finding jobs, and the hiring rate is declining..
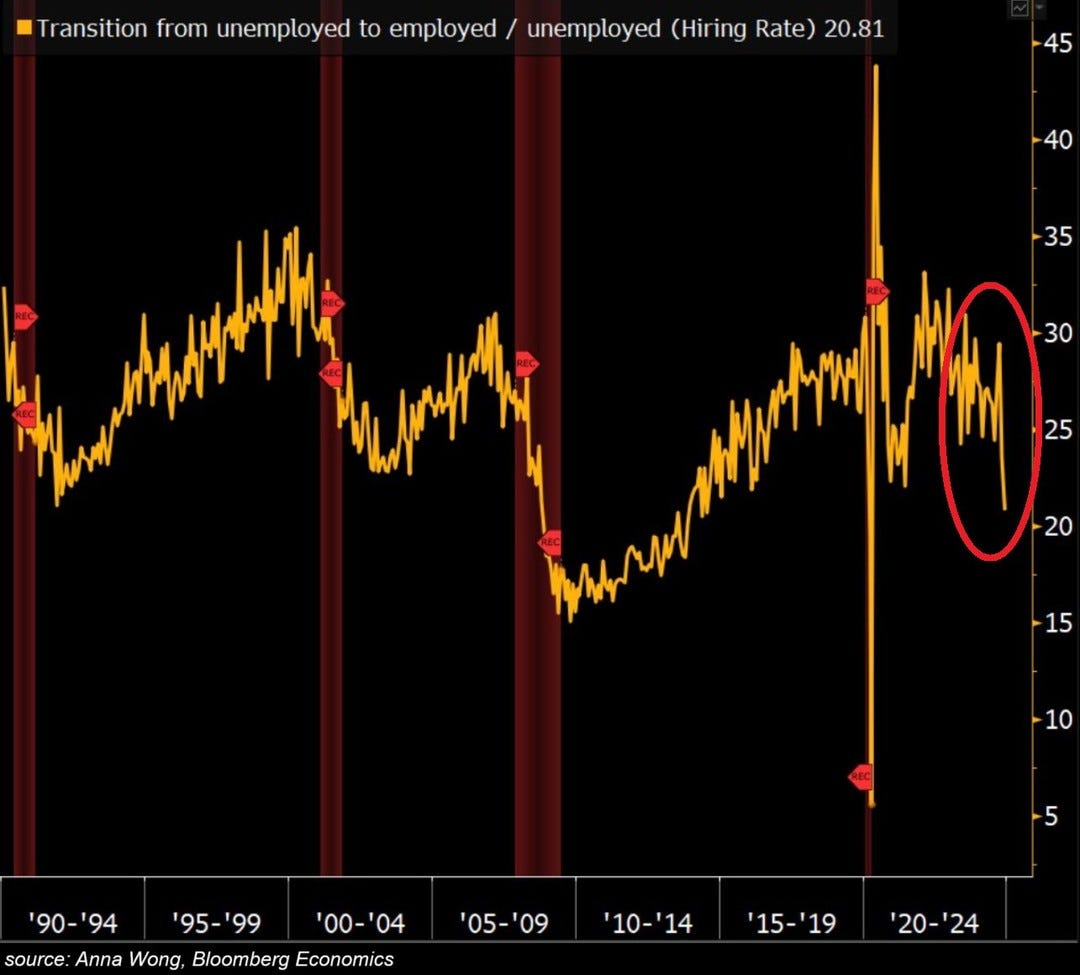
Such a rapid drop has never occurred outside recessions.
By looking at this data, we cannot turn optimistic about the future of the labor market.
Finally, let’s review job openings and layoffs data as we do every month.
JOB OPENINGS AND LAYOFFS
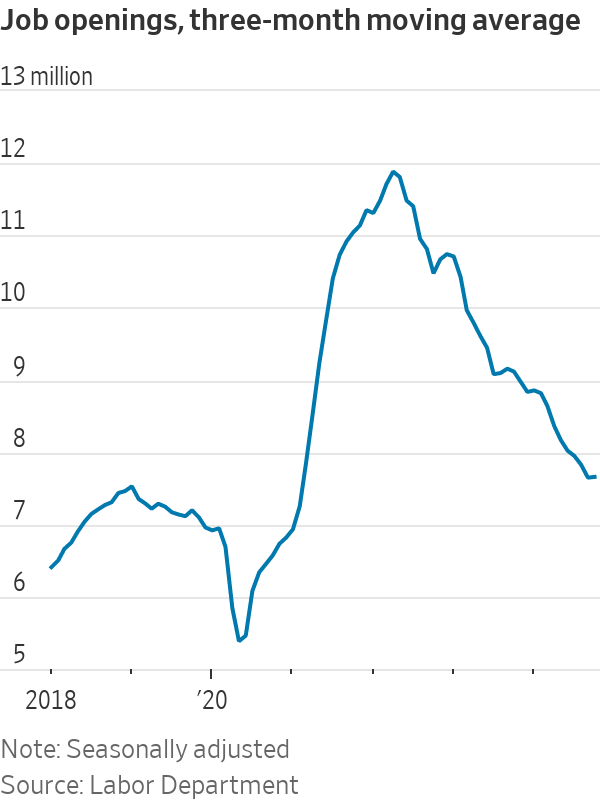
US job openings for October increased to 7.74 million from 7.37 million in September and above Wall Street expectations of 7.52 million. The 3-month moving average, however, remained largely unchanged suggesting the trend is not reversing.
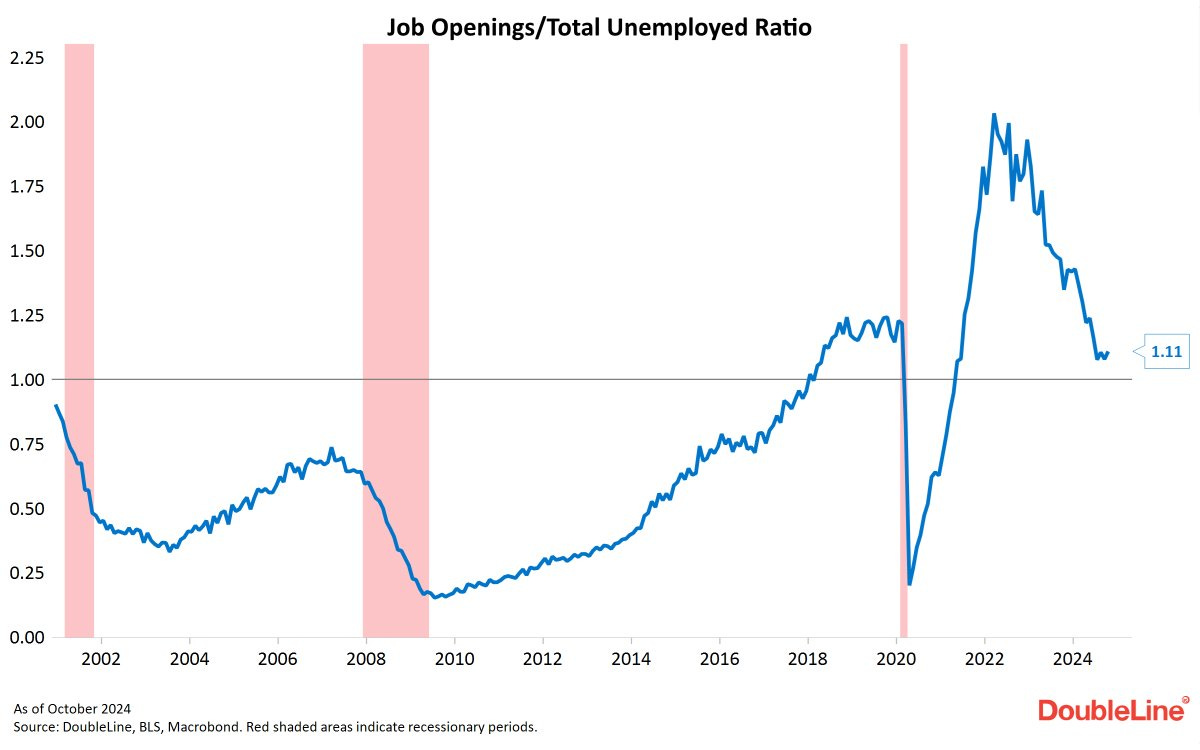
At the same time, the ratio of job openings to total people unemployed remained at 1.11 points, below the pre-pandemic levels.
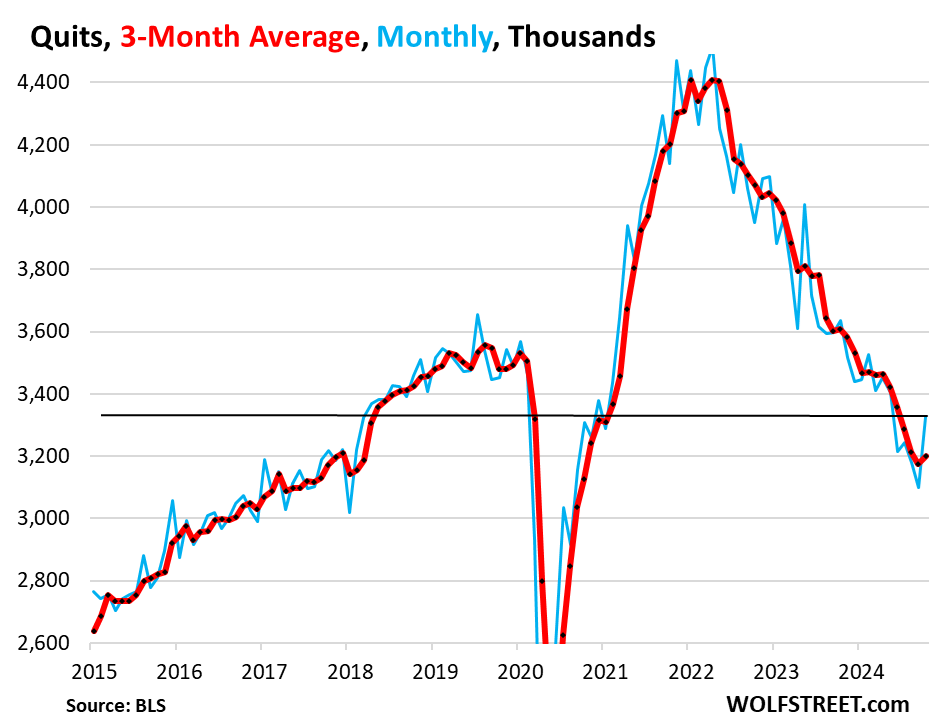
Moreover, the quits rate rose to 2.1%, though its 3-month moving average barely changed.
Concerningly, hires as % of total employment has dropped to 3.3%, the lowest since the 2020 Pandemic crisis. The hiring rate is now well below the 2015-2019 pre-pandemic average of 3.8% and below the 2001 recession levels.
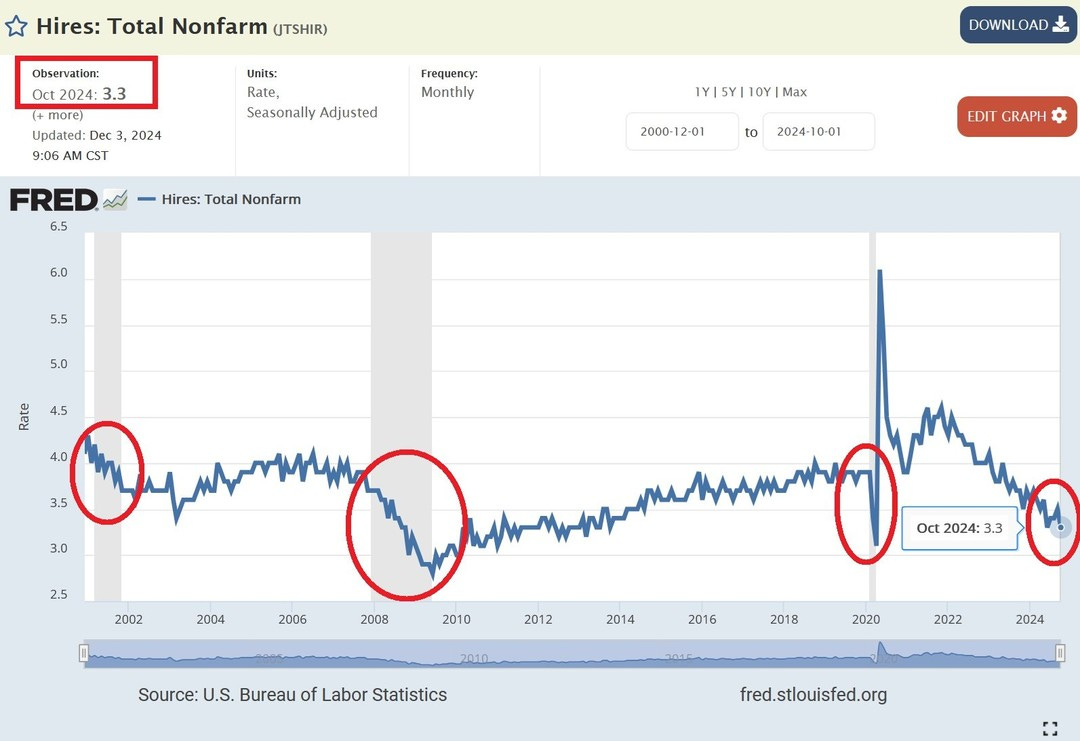
Overall, hiring has been falling for 3 years. This is a confirmation of the weakness shown in the last chart of the previous section.
The problem with this data is that it comes with a 2-month lag. It is, therefore, more beneficial to follow new job postings on Indeed. As of the last week, new job postings tumbled 38% year-over-year and hit the lowest level in over 4 years.
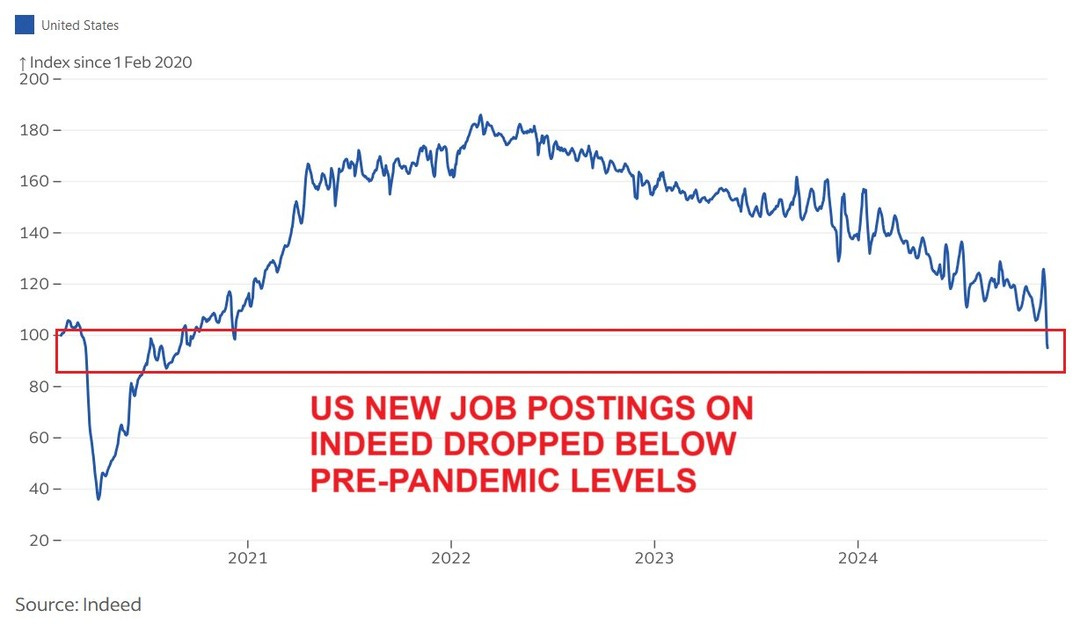
They are now 5% below the January 2020 pre-pandemic levels suggesting further deterioration in job openings reported by the BLS and in the job market data overall.
Meanwhile, US job cut announcements continue to rise.
US-based firms announced 57,727 job cuts in November, the 3rd-highest number since the Great Financial Crisis.
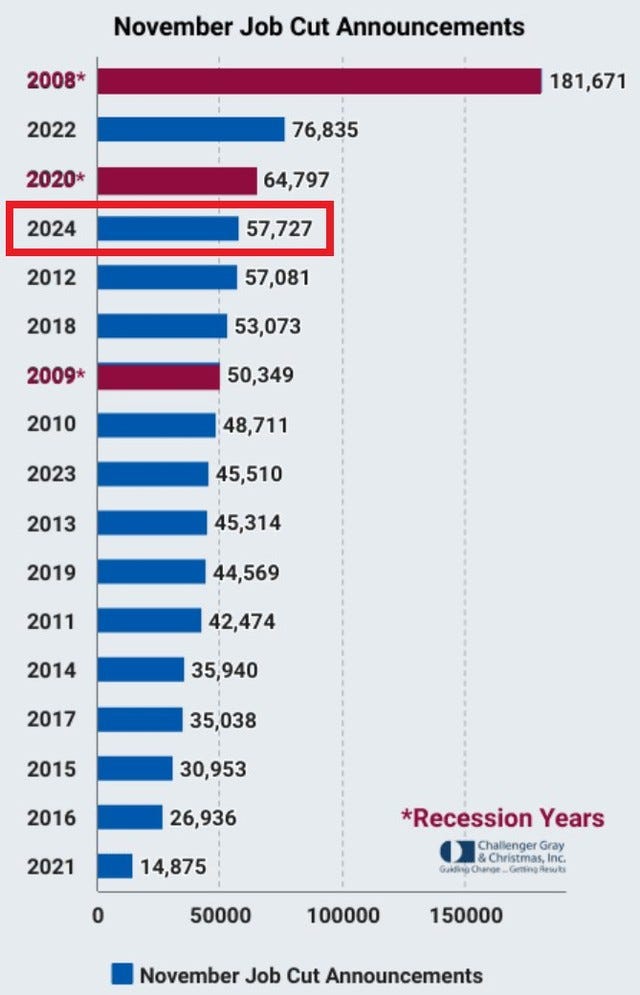
Year-to-date, there have been 722,566 job cuts, the largest amount since 2009, excluding the 2020 Pandemic Crisis year.
November's weakness was driven by the Automotive sector where firms announced 11,506 job cuts, the second-highest since the 2020 Pandemic Crisis.
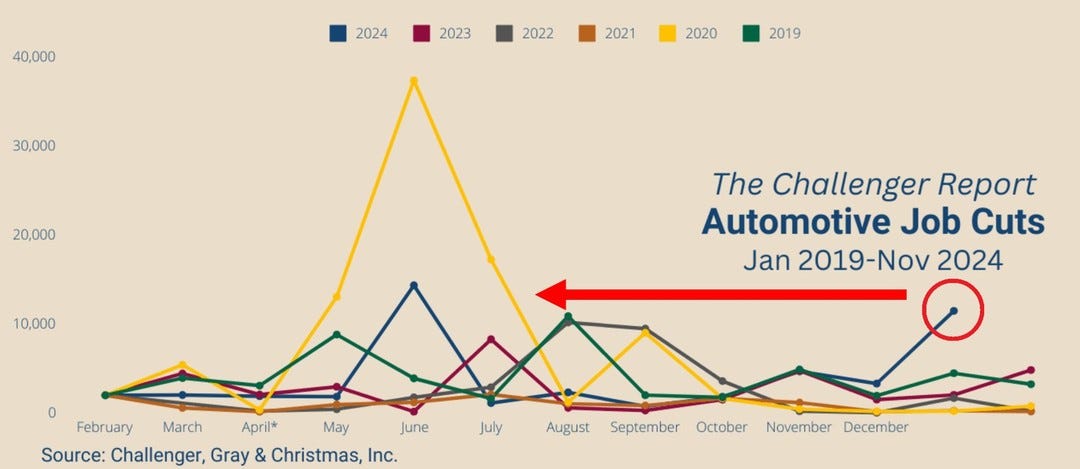
Year-to-date, automotive firms have announced 45,820 job cuts which is 59% higher than last year.
Minimal hiring and rising job cuts suggest a rise in unemployment during the next year.
SUMMARY
Despite a strong nonfarm payrolls headline number the job market of the world’s largest economy continues to deteriorate. Furthermore, there are no signs that this trend reverses anytime soon.
Additionally, it will take months until all job market data will be revised. This has material implications for US GDP because labor data are used to estimate economic growth. Therefore, for GDP revisions it will take even longer, up to a few years.
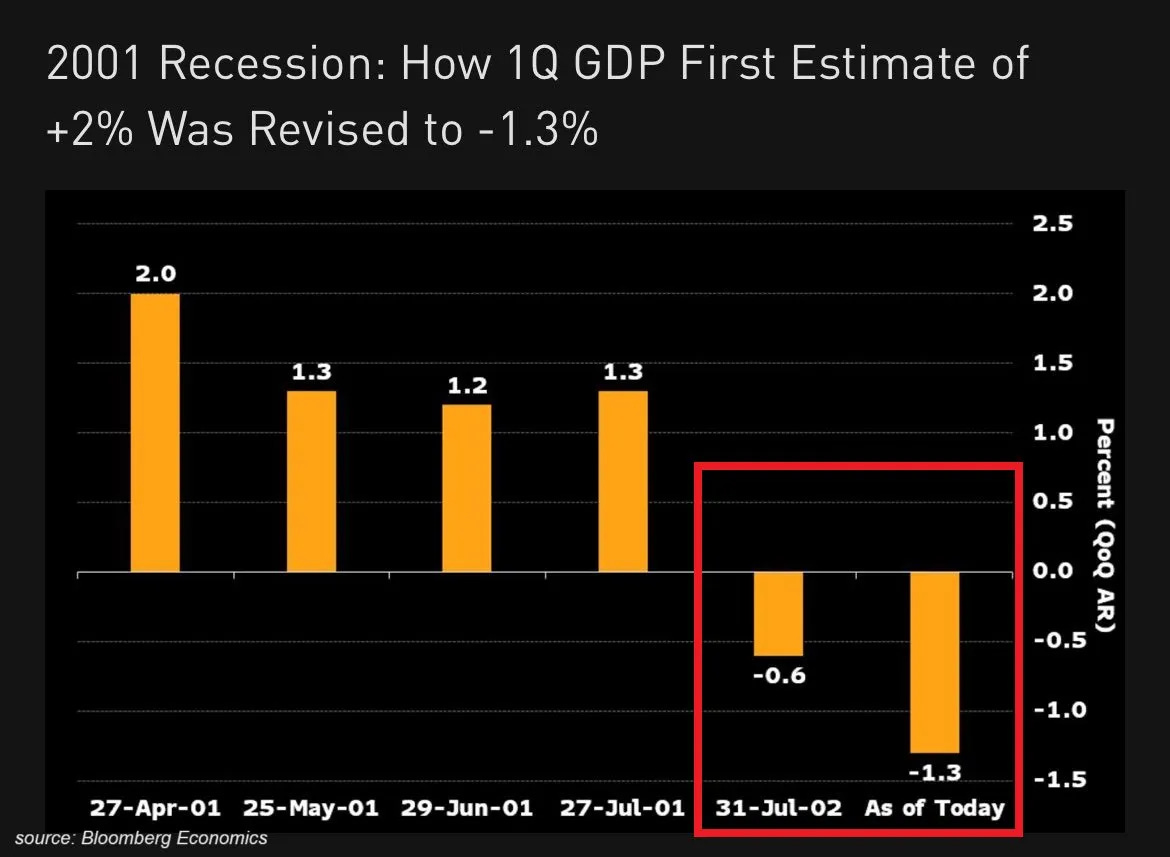
Notably, in 2001 it took more than 12 months to get the final Q1 GDP growth number. After initially reported in April 2001, it was adjusted down from +2.0% to -1.3%. It means the official date of the US economic recession was set over a year after the initial GDP release.
Having said that, one of the ways to take advantage of this delay is to follow the US unemployment rate but more importantly leading indicators of this metric. This is because the jobless rate is also one of the most lagging economic indicators.
Ultimately, as analyzed in the piece, we should not be surprised if we will see the unemployment rate reach at least 5% in the next year.


If you find it informative and helpful you may consider an annual subscription, become a Founding Member, and follow me on Twitter or Nostr:
Why subscribe?