Is the US economy heading for a soft landing? Part 2/2
Arguments for and against the possibility that the US economy will avoid a recession during this business cycle
This is the second part of my analysis trying to answer the question of whether the United States economy is heading for a soft landing or a hard landing. If you have not read the first piece please find the link below.
ARGUMENTS FOR A SOFT LANDING OR AN AVOIDANCE OF A RECESSION
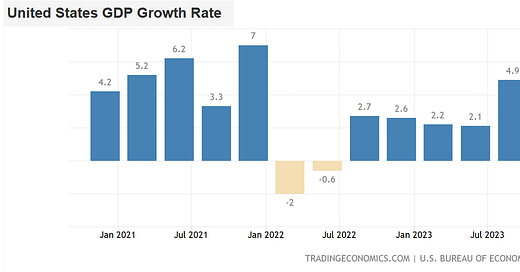
The first and foremost argument for a soft landing scenario is unsurprisingly a key measure of economic growth, gross domestic product, which so far has not been showing signs of slowing. The graph below presents the quarterly US GDP growth rate using a quarter-over-quarter basis.
We can read from the chart that in the third quarter of 2023, the world's largest economy grew by 4.9% from the second quarter on an annualized basis (recalculated to show an annual rate). This is, however, almost three months old data even though the final number was released on December 21st.
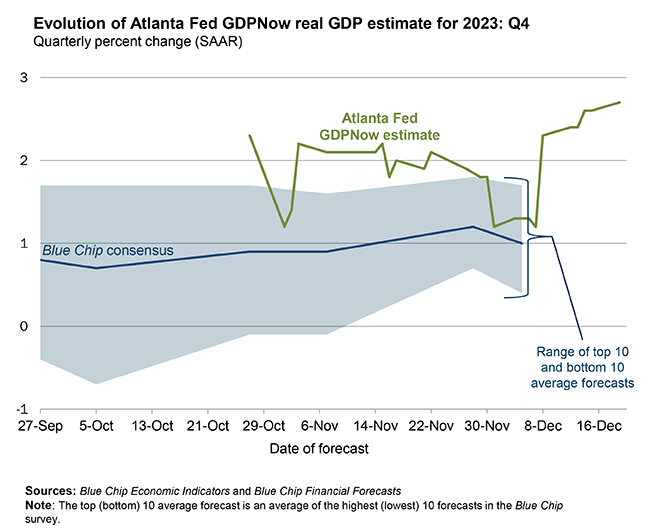
Fortunately, we can track the growth of the most recent period using the so-called economic nowcasts such as Atlanta Fed GDPNow. In other words, economic growth projections which are calculated based on the already-released economic data. The above-mentioned Federal Reserve Bank of Atlanta provides its GDP forecasts update every few days. As you can see below, the latest estimate as of December 19th shows 2.7% growth of the US economy in the fourth quarter of 2023.
It appears that the US has had another solid quarter of economic growth. All things considered, we may state with almost certainty that the United States has not experienced a recession in 2023.
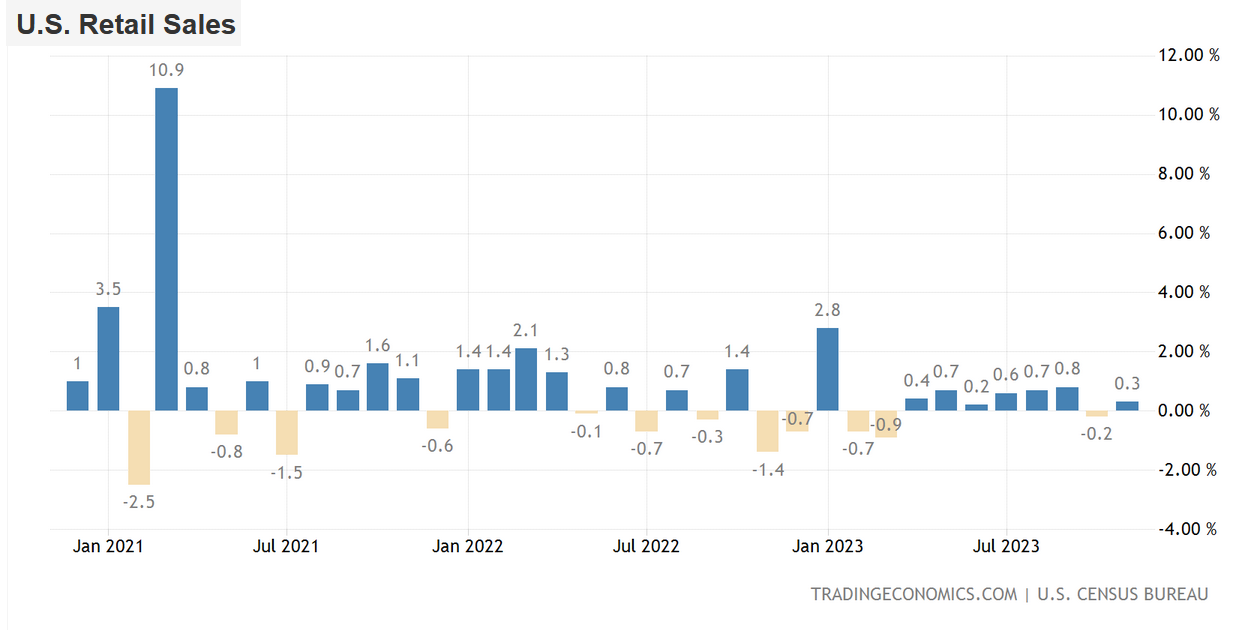
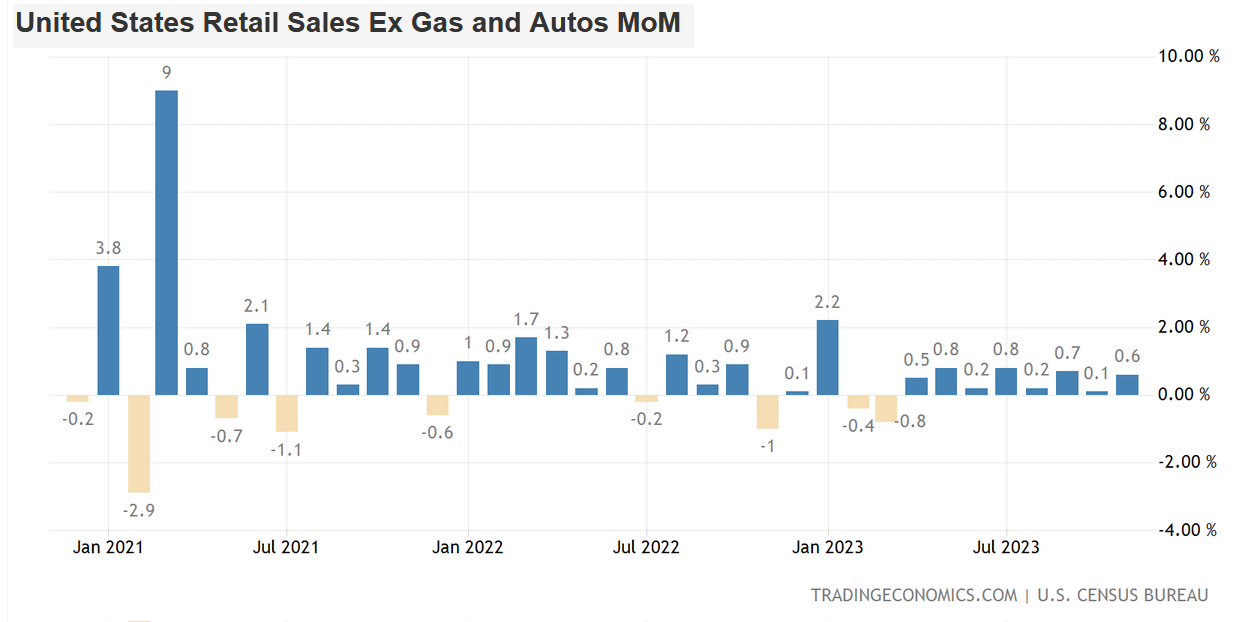
Moving forward, another piece of data showing signs of a soft landing which is also firmly linked to the GDP is retail sales. Investors and analysts also look at the core retail sales which excludes automobiles, gasoline, building materials, and food services which have a higher relation with the GDP data.
As you can see on the above charts, both metrics have been consistently growing month over month this year, except for the first quarter.
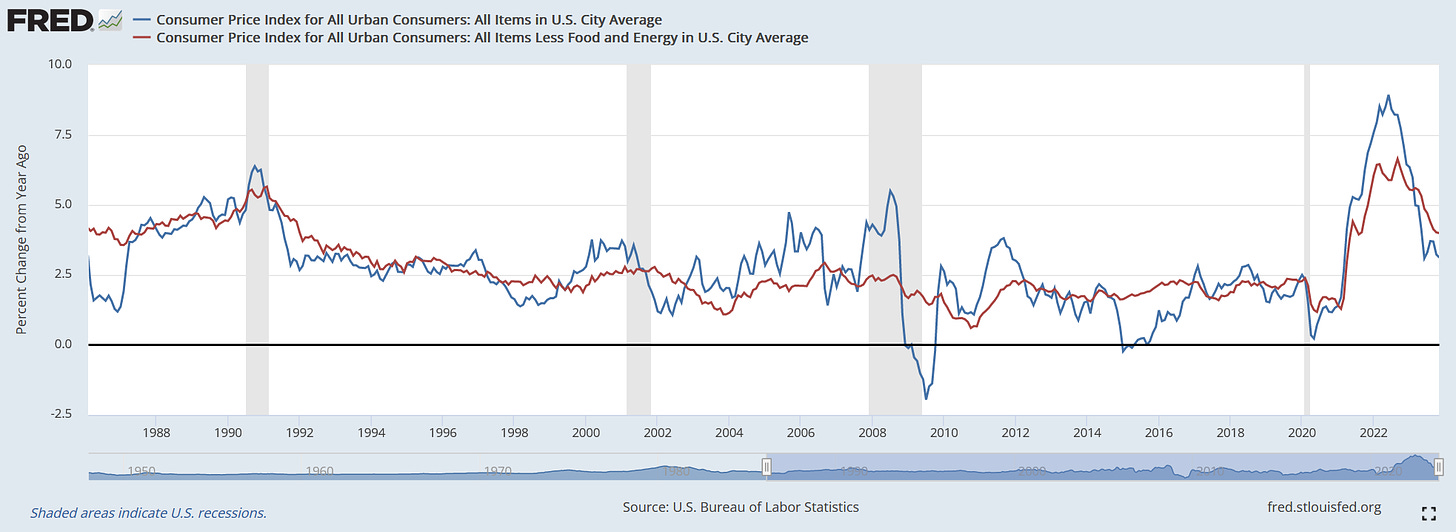
Next, we should also have a look at the inflation rate which has been falling towards the Fed’s 2% inflation target. In the chart below, you can see the most common measure, Consumer Price Index, CPI (blue line), and Core CPI which excludes volatile food and energy costs (red line).
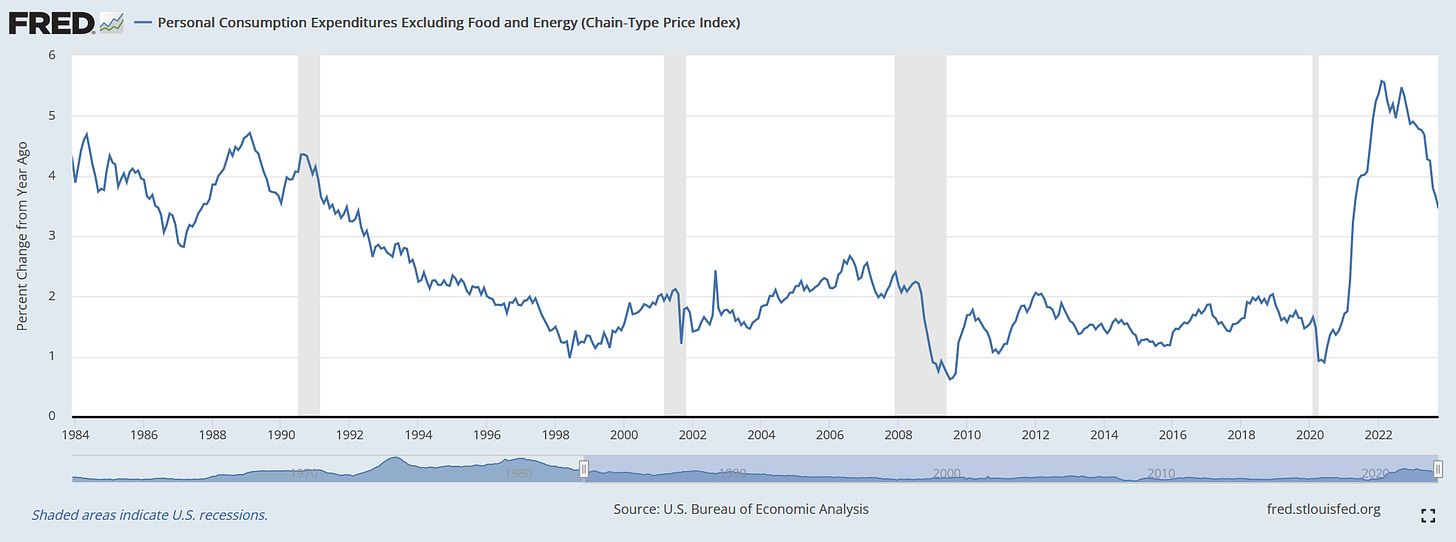
As of November, all prices rose by 3.1% on average versus a year ago while prices excluding food and energy by 4.0% versus 2022. Moreover, the core PCE (Personal Consumption Expenditures) inflation index which is a favorite Federal Reserve metric has fallen to 3.5%.
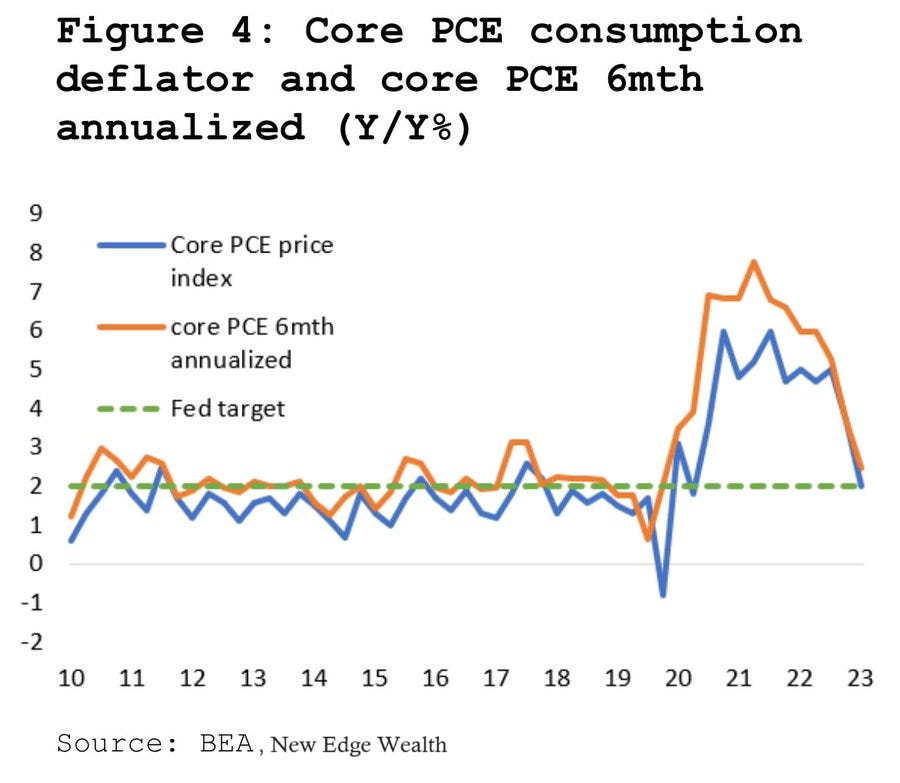
Digging a little bit deeper, the core PCE 6 months annualized data has almost reached the 2% target (orange line).
In any case, the fight is not over yet but it is coming closer to the final goal and is consistent with the soft-landing outcome.
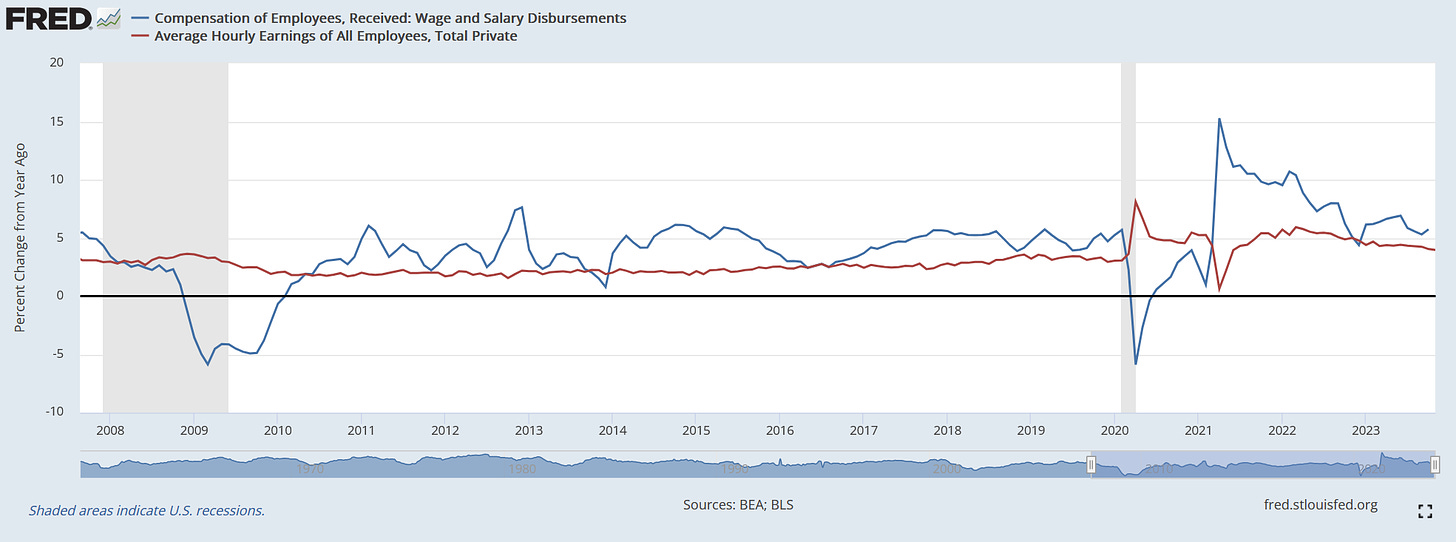
Finally, the last measures I would like to show that support a soft landing scenario are coming from the US labor market. The following chart exhibits wages (blue line) and average hourly earnings growth rates (red line).
Both have been tracking around a 4-5% year-over-year increase in the past several months which is quite healthy growth in salaries.
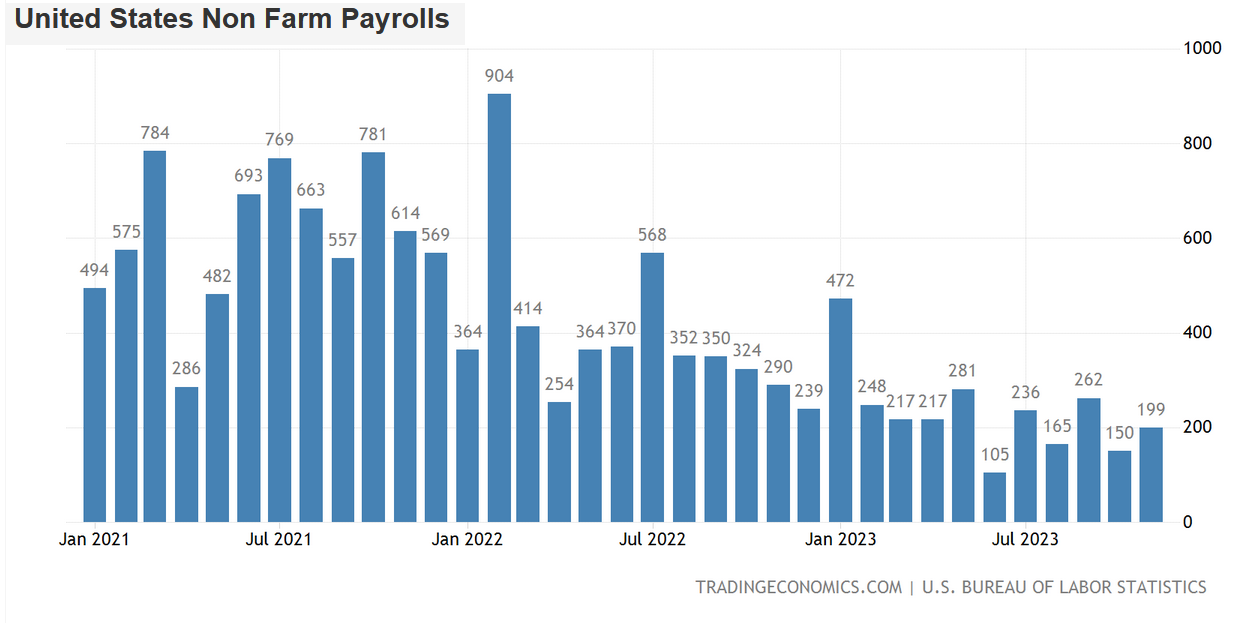
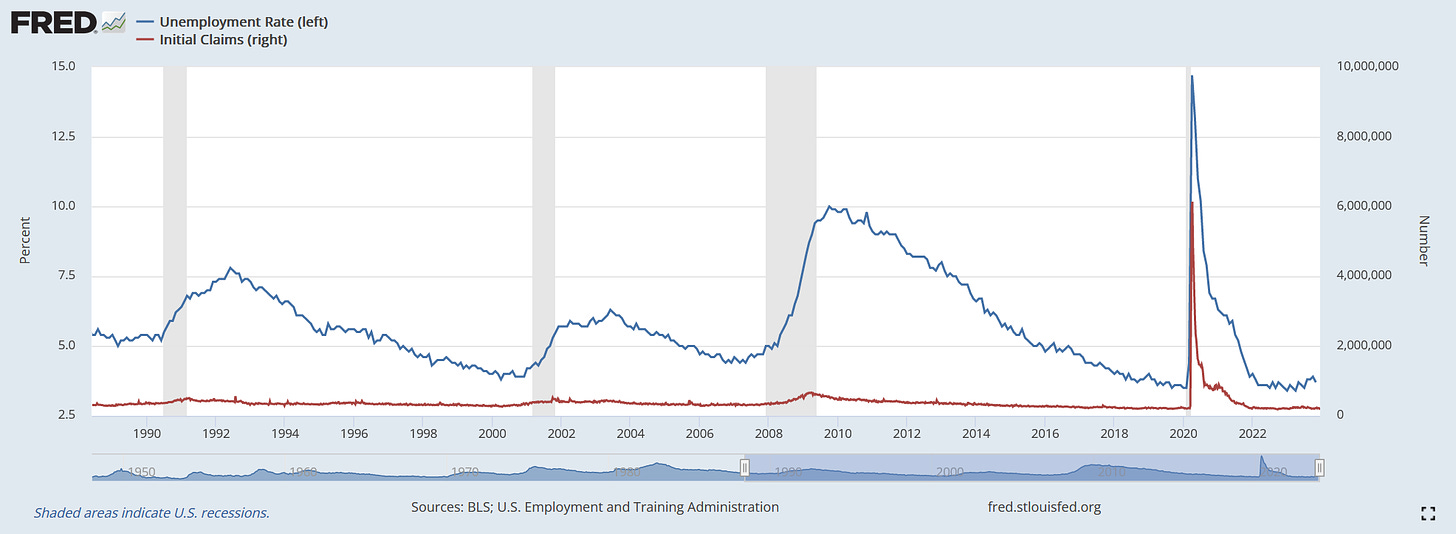
In addition, the country has been adding roughly 200,000 jobs on average every month this year with the unemployment rate (blue line) being stubbornly below 4% and Initial Jobless Claims (red line) hovering at or slightly above 200,000 every week which is a relatively low number when compared to recessionary periods (second chart below).
To clarify, Initial Jobless Claims measures the number of people in the US who filed for unemployment insurance for the first time during a week. Overall, the labor market in the United States looks resilient.
CONCLUSION
Summing things up, there is plenty of data justifying both scenarios, the soft landing and the hard landing. In picking one of them, it depends what kind of data one chooses or thinks is the most relevant. I personally think, however, that most of the data reported showing that the United States is currently avoiding a recession is backward looking while in markets, and the economy a key is to try to predict the future. Having said that, I am leaning toward the recession scenario as I prefer to believe more in the leading indicators I’ve presented in the first part of the analysis. As always, the timing and the magnitude are unknown but if we have already seen the last interest rate hike from the Fed and the balance sheet shrinkage will continue then we may expect some sort of cracks within the US economy to occur in the first half of 2024.
One would ask which assets would perform the best in such a scenario. I think that would be the US dollar, US long-term government bonds, gold (after the initial drop), Swiss Franc, and perhaps defensive stocks such as utilities and healthcare.
If you find it informative and helpful you may consider buying me a coffee and follow me on Twitter:




"and the economy a key is to try to predict the future"
Was this what you meant?
and with the economy, the key is to try to predict the future