Gold is a great asset to own in a portfolio, especially during times of declining and lower interest rates with low/declining inflation as well as turbulent times geopolitically and economically (except for liquidity crises). For the last several weeks the yellow metal has been trading above $2,000 per ounce and I think it might be a good time to have a closer look at what’s coming ahead for the so-called barbarous relic in both the short-term and the longer-term.
GOLD AND ITS RELATION WITH THE REAL 10-YEAR YIELD
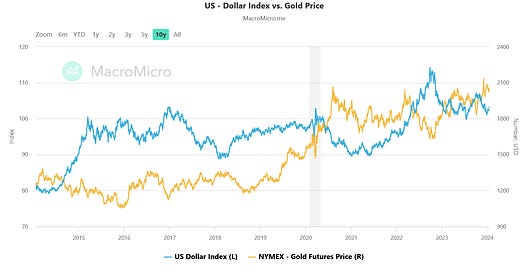
First things first, it is crucial to mention that it is commonly believed that gold prices are inversely related to the US dollar most of the time. In the chart below we can see this inverse relationship though it is not that perfect and many times it diverges.
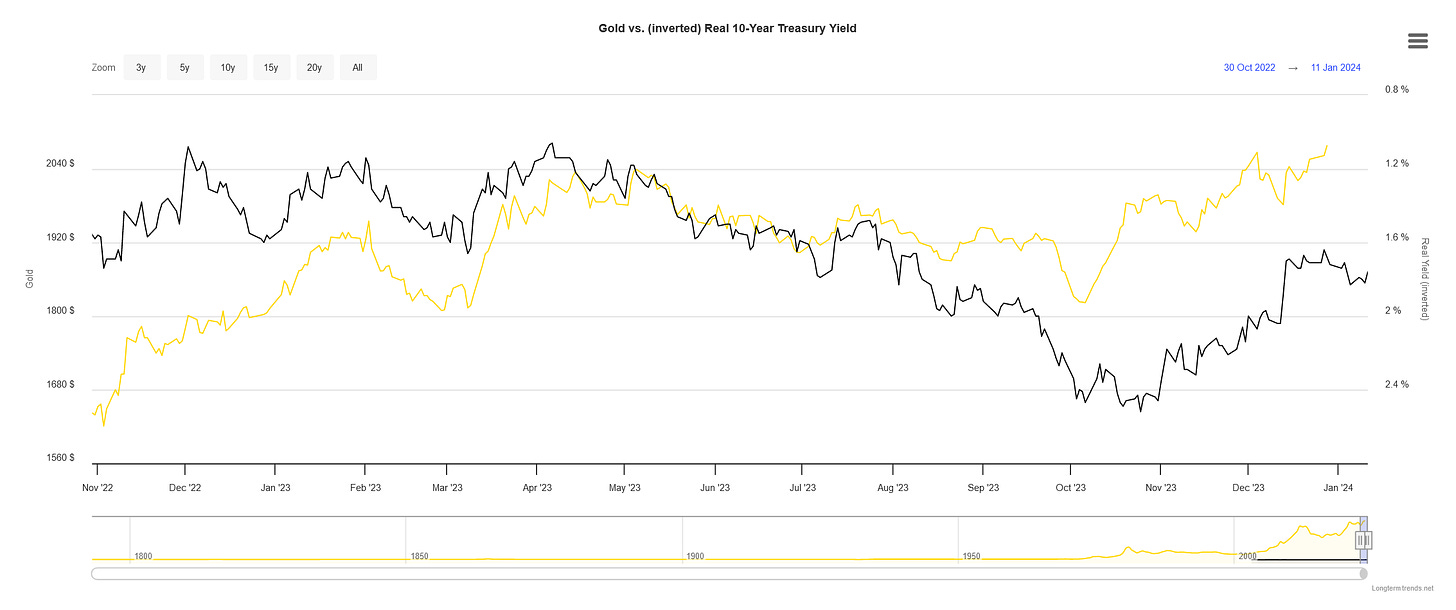
Therefore, I believe it is more important to follow the relationship between gold and the 10-year US government bond yield adjusted for inflation called a real 10-year yield. Why? Because rising interest rates provide an opportunity cost to holding gold as it does not pay any interest. Thus, it might be relatively expensive to hold the metal when real interest rates are high. On the flip side, when real yields are negative, those who hold cash and bonds lose money. As a consequence, investors are more eager to buy gold. As it is presented in the below figure, from the onset of the Great Financial Crisis in 2007 until March 2022 gold prices (yellow line) had been closely tracking the inverted real 10-year yield (black line). It is important to note that the real yield on the chart represents the 10-year US government bond yield adjusted for inflation expectations in 10 years which can be tracked here.
In March 2022, this inverse relationship broke for several months due to three factors:
The 10-year yield started rapidly rising in expectations of stronger performance of the US economy.
Inflation expectations for 10 years ahead had been declining during the same time.
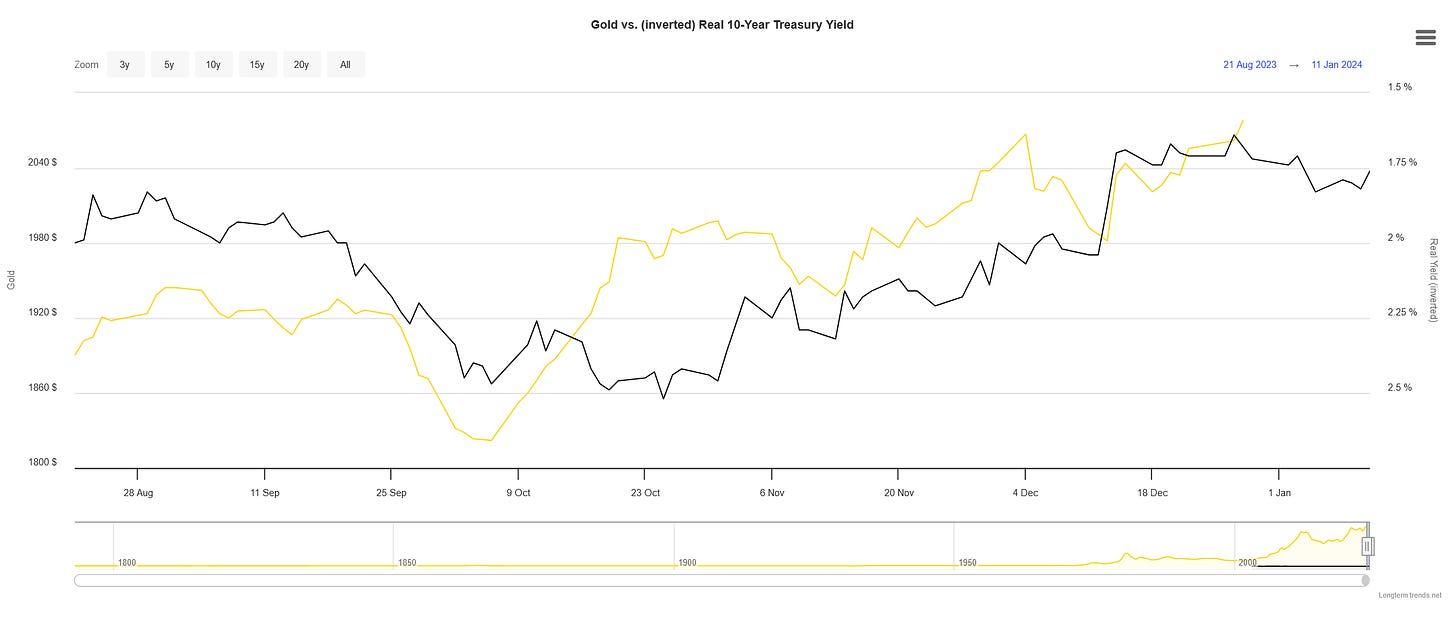
Gold initially followed the relationship but could not catch up with such a rapid pace of real yields falling and in October 2022 bottomed as real yields took a breather from their declines. After that, the inverse relationship roughly came back intact as you can see on the chart below.
Subsequently, gold and inverted real 10-year yield have been moving in tandem since August 2023.
All things considered, I think the relationship will continue this year unless a liquidity crisis comes as it took place in the first weeks of the 2020 spring sell-off (remember after an initial discount, the gold took off pretty quickly as yields started to decline). Let’s then consider three scenarios that can take place depending on the US economy’s performance and the moves of the 10-year yield.
BASE CASE FOR 2024 (70% probability of occurring)
In this scenario, I believe that interest rates in the United States will start to move down around March-April, and the 10-year treasury yield will commence to decline again a little bit before that as inflation expectations for the 10-year ahead will stay steady. For the entire 2024, I would expect 1.25% interest rate cuts by the Fed (5 rate reductions) while the market currently expects more than 1.5%. As I mentioned, the 10-year yield will be moving ahead of these cuts and as a result, I see roughly a 1% reduction to around 3%. Based on the past relationship with gold that would imply a $200-$250 upside for the yellow metal.
BULL CASE FOR 2024 (20% probability of occurring)
If the US economy experiences a significant and quick decline in economic activity and the Fed will have to cut by more than 2% in 2024 then it might bring the 10-year treasury yield down by almost 2% as well. That would imply a $400-$500 price increase in gold this year.
BEAR CASE FOR 2024 (10% probability of occurring)
If inflation is much more stubborn and economic activity does not slow then probably the Fed will cut only by 0.75%-1.00%. In this scenario, the 10-year yield might drop by approximately 0.5% providing an upside to gold by $100-$125.
SHORT-TERM HORIZON
The possibilities mentioned above provide outcomes for the entire 2024. However, in the short-term, I believe the 10-year yield is heading higher for a couple of weeks which may bring some downside to gold and perhaps a better entry point for the medium to longer term. Recently, the 10-year yield broke above 4% and the descending trendline which gives more room to the upside given how resilient the economic data has recently been (US retail sales, CPI inflation readings higher than expected). I wouldn’t be surprised if it stops around 4.4%-4.5% area.
Having said that, I expect gold to correct by around $100 giving a great entry point for the although I do not rule out even a $150 downside correction.
SUMMARY
The potential for gold to move up by double-digit percentages this year is quite substantial considering how things have been shaping in terms of the interest rate expectations in the United States. If everything plays out as it was outlined here, in the next several days we might have a great opportunity to add an excellent asset to our portfolios or to make a profitable trade as the odds for the upside move this year are really high.
If you find it informative and helpful you may consider buying me a coffee and follow me on Twitter:


