How do US stocks usually perform after a 5%+ sell-off?
The longer the time horizon the better the returns
The S&P 500 is down by almost 9% from its mid-July all-time record. It is difficult to say whether the bottom is already in (likely not) but we can look at the past to understand how the index performed over time after drawdowns.
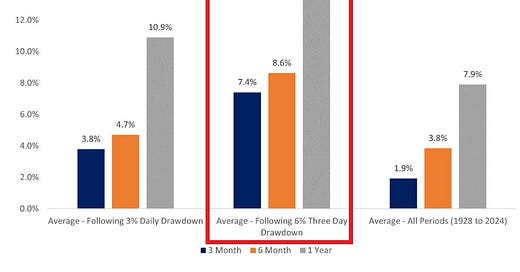
Interestingly, the S&P 500 has returned 10.9% on average within 12 months after a 3% daily drawdown and 4.7% within 6 months.
Moreover, following a 6% three-day drawdown the average 1-year return has been 15.4% and 8.6% within 6 months which would apply to the current market behavior.
By comparison, the average annual return over the last 95 years has been 7.9% and the 6-month return has amounted to 3.8%. In other words, investing after notable drawdowns can significantly improve portfolio returns.
This is why it is really important to have some cash or short-term government bonds on the sidelines. Especially during the times of the market euphoria.
If you find it informative and helpful you may consider a paid subscription (or annual if subscribed), become a Founding Member, and follow me on Twitter:
Why subscribe?


