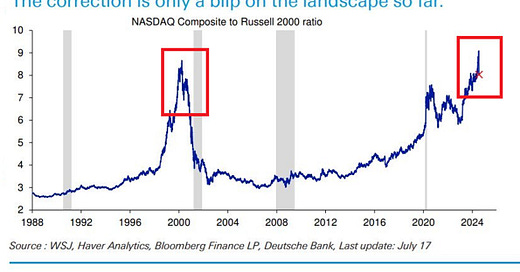
Chart of the week: US Technology to small-capitalization stocks ratio still sits at the Dot-Com Bubble levels
NASDAQ index relative to Russell 2000 index subsided somewhat over the last 2 weeks.
NASDAQ Composite Index, heavily weighted towards the technology sector and consisting of more than 3,000 stocks, relative to the Russell 2000 index of roughly 2000 small-capitalization stocks declined over the past 2 weeks from a record ~9.2x to ~8.1x (cross on the graph).
This is a ratio of NASDAQ prices to Russell 2000 prices. Friday’s close quote of the NASDAQ was 17,726.94 whereas the Russell 2000 was 2,184.35. Dividing the former by the latter gives us a ratio of 8.12x which is slightly below the previous historical record posted during the Internet Bubble of the 1990s.
In other words, US technology stocks are 8 times pricier than small-capitalization stocks. By comparison, the long-term average has been around 4.
Over the last 2 weeks, the Russell 2000 has rallied by 7% and was even gaining as much as 12% at some point. The last 3 days, however, have brought almost a 4% loss for small-caps due to the broad market sell-off.
At the same time, the NASDAQ composite has dropped by ~4% providing the Russell 2000 an 11% better performance.
Is this a time for small-capitalization stocks to shine? It depends on what will happen to the US economy in the upcoming months as small firms are a better representation of economic activity and are more susceptible to interest rates movements. For more details please read the below article:
If you find it informative and helpful you may consider a paid subscription (or annual if subscribed), become a Founding Member, and follow me on Twitter:
Why subscribe?


