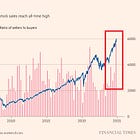
⚠️CHART OF THE WEEK: The Buffett indicator hits a new all-time high
The US stock market is worth more than two times the world's largest economy
BLACK WEEK OFFER! Please find below a 10% discount for an annual subscription to access premium content and more deep analysis.
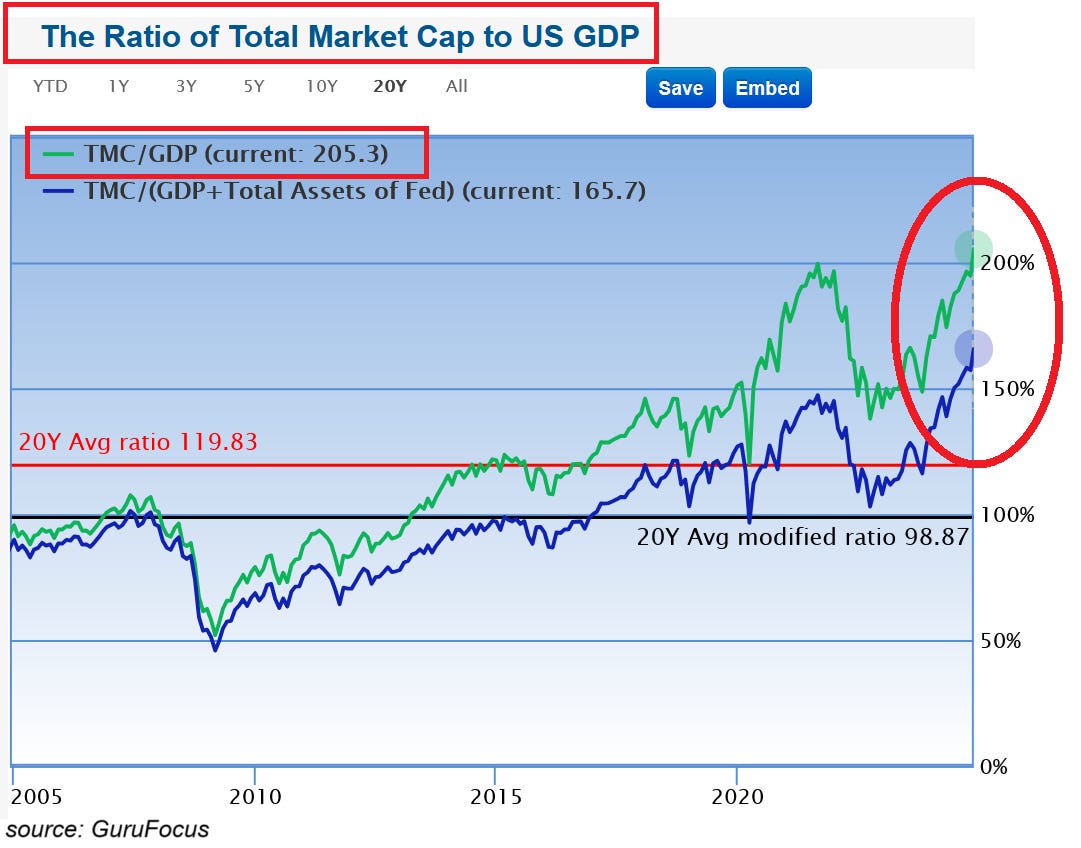
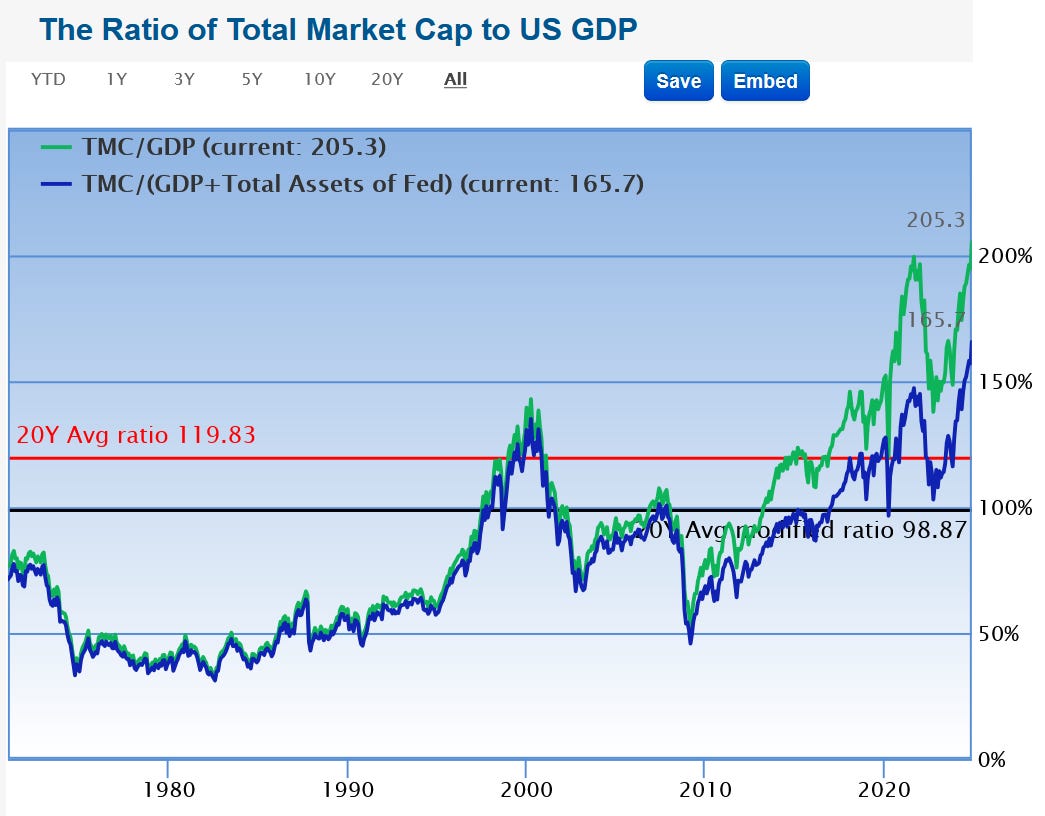
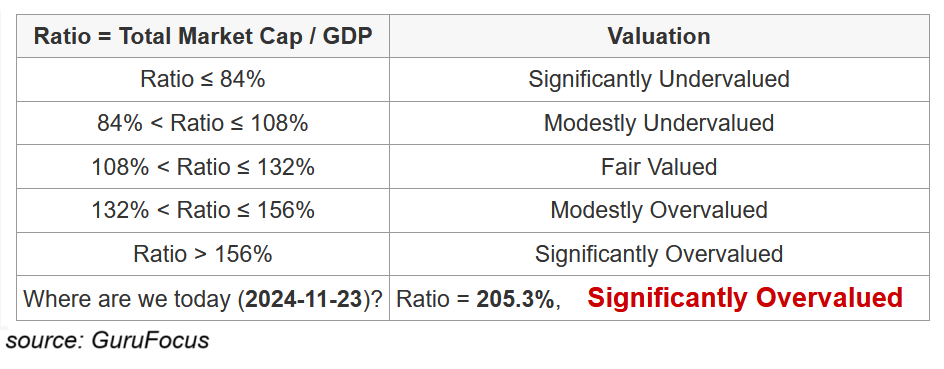
The Buffett indicator, the ratio of the US stock market capitalization to US GDP reached a new record of 205%.
It has exceeded the previous record of 200% set before the 2022 bear market.
The ratio is also well above the 2000 Dot-Com Bubble peak. To put this into perspective, the 20-year average is 120%.
In other words, the stock market has never been more overvalued based on this metric.
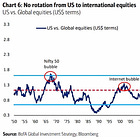
People may say that this indicator is less relevant now as US companies have become more global and more of their revenues come from abroad than in the past. This is indeed true, but at the same time, the US economy's share in global GDP has also increased. More below:
Therefore, the Buffett indicator is still a very valid metric in the medium and long-term.
If you find it informative and helpful you may consider a paid subscription (or annual if subscribed), become a Founding Member, and follow me on Twitter:
Why subscribe?


