Chart of the week: How expensive the Magnificent 7 has become?
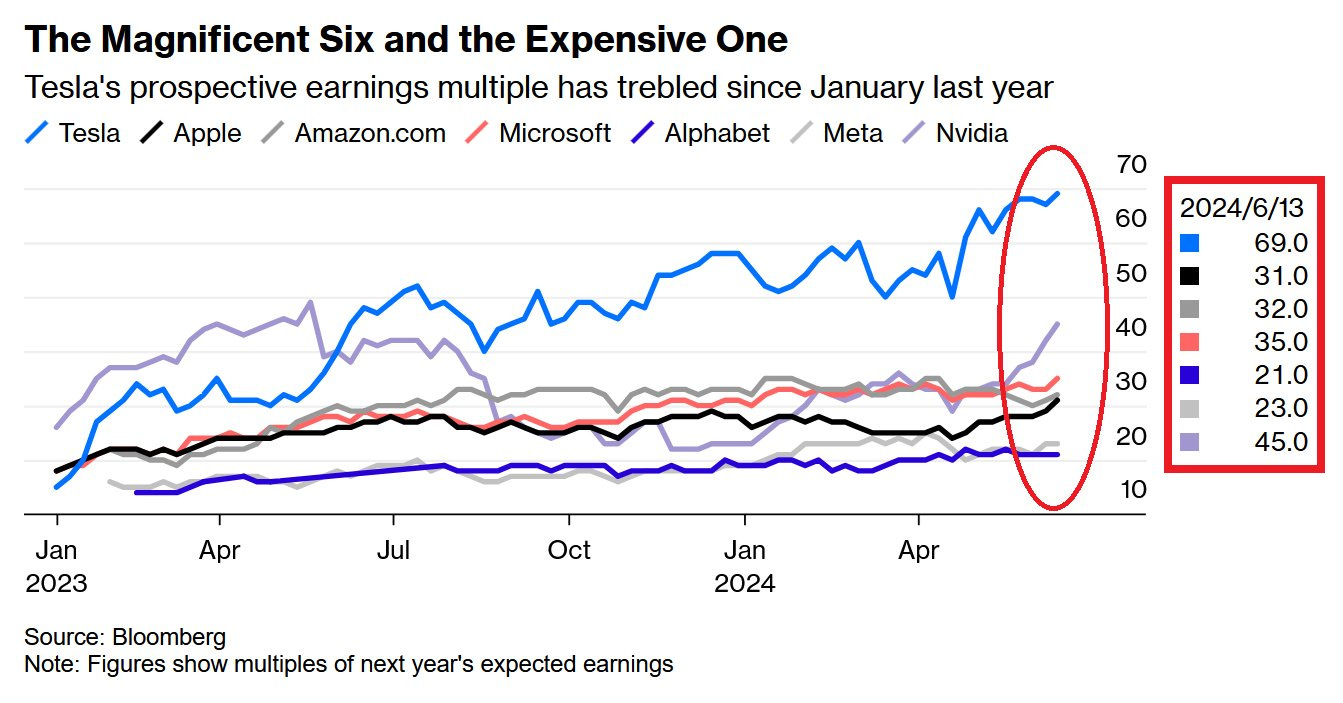
Tesla and Nvidia stocks are looking pretty expensive these days
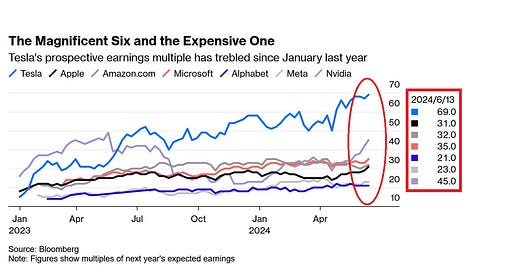
Tesla's forward price-to-earnings ratio (P/E) has recently hit 69x despite a 30% share drop year-to-date. Forward means that earnings in the denominator are estimated by Wall Street (average analysts’ projections are taken) for the next 12 months.
This is not an ideal metric as professionals may be overoptimistic or overpessimistic in their assessment but when comparing to other stocks, the whole sector, or the history it may provide a useful valuation picture.
The 2nd expensive among the Magnificent 7 is Nvidia with forward P/E at 45x after a 167% share price run this year.
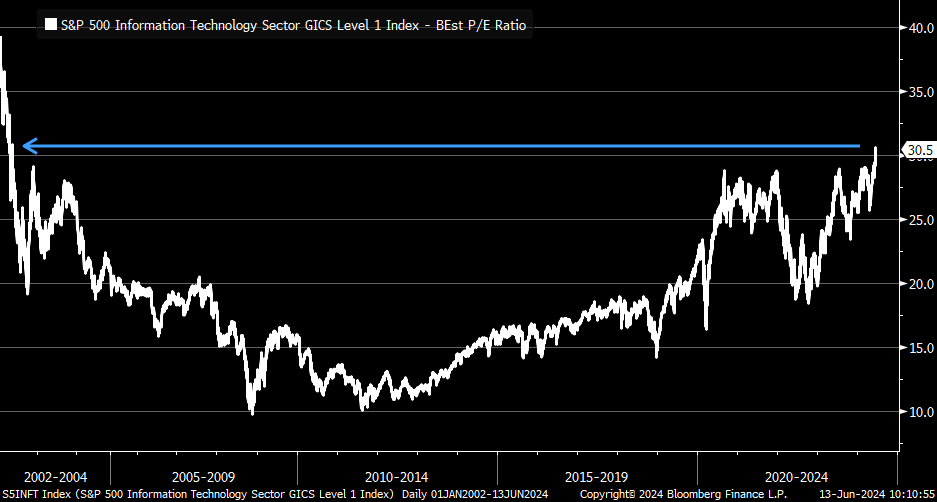
Absolute values may not provide the entire picture and therefore it is useful to compare it to the entire US technology sector. Namely, the tech sector forward P/E is now 30.5x, which is the highest in 12 years. This is even higher than before the 2022 bear market and the COVID crash.
Key takeaways from this are that the technology sector has become historically expensive while Tesla and Nvidia look pricey relative to the entire sector.
To put this into another perspective, the S&P 500 forward P/E ratio is 21x, way below the Tech sector, Tesla, and Nvidia combined. We have to keep in mind, though, that over the last few decades technology stocks have usually traded 3-5 points above the S&P 500 when looking at the forward P/E metric.
Does that mean the technology stocks or Nvidia are in a bubble? You can find out full analysis in the below 2 articles:
If you find it informative and helpful you may consider a paid subscription (or annual if subscribed), buying me a coffee, and following me on Twitter:
Why subscribe?

