A pullback in the S&P 500 has likely not finished yet
What's next for financial markets? 01/2024 Week Recap.
In this new series which will be held weekly or bi-weekly depending on how dynamicly the markets will change I will be bringing out an analysis of major assets and trying to figure out what awaits them going forward. The key will be to look under the surface to see whether anything positive or concerning shapes up for what we invest in and trade the most.
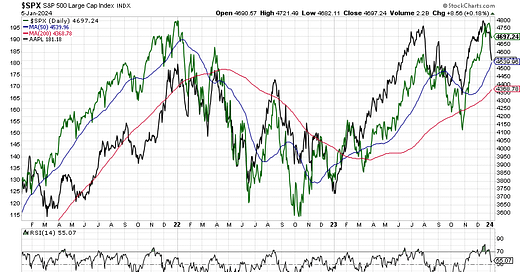
First things first, we need to look at the S&P 500 index as this is the most followed benchmark in the world and usually drives other stock markets in developed countries. As we know, in recent years the index has been mainly driven by the performance of the so-called Magnificent Seven (Amazon, Apple, Google, Meta, Microsoft, Nvidia, and Tesla). Among them, the largest one and the most watched is Apple with almost $3 trillion in market capitalization. As you can see on the chart below, the correlation between Apple (black line) and the S&P 500 (green line) has been really high:
Last week, Apple stock was downgraded by Barclays and Piper Sandler analysts to sell and hold, respectively. This triggered an almost 6% drop in prices and also weighed on the S&P 500 which fell roughly 2% last week. When looking at the above chart we can see that the decline in Apple share prices could imply a further 3% decrease in the S&P 500 to at least its 50-day moving average (blue line). The argument here is that the pullback in the index has not ended yet.
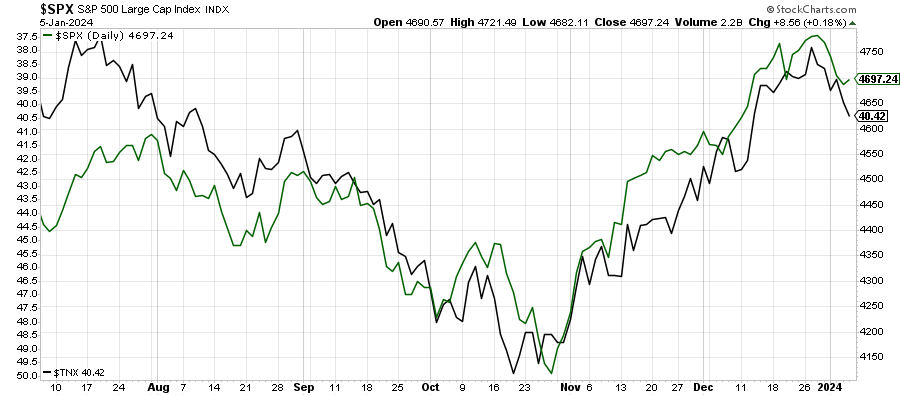
To support this argument it is necessary to check a few other metrics and assets among which there are US government bond yields, especially the 10-year which has been strongly inversely correlated with the index over the last several months. As the US economy has been heading toward the end of the business cycle I think it is crucial to regularly look at bond yields as interest rates are one of the main drivers of the economy and financial markets. The chart below presents the inverse performance of the 10-year US government bond yield (black line) and the S&P 500 (green line) over the past six months.
In the last several days, the 10-year yield has seen a pretty rapid reversal and rose from roughly 3.8% to above 4% as investors have started to realize that the recent move down could have been exaggerated and the Federal Reserve might not be as eager to cut rates as initially thought. Additionally, the Fed speakers have been trying to communicate that the market has moved ahead of itself. Therefore, the yields should continue to rise a bit which should cause US stocks to carry on with their declines.
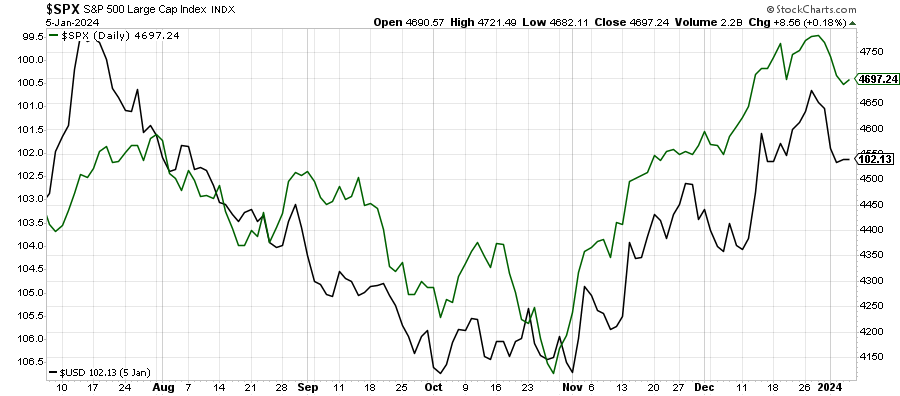
The above rationalization is also highly related to the behavior of the US dollar which is presented on the black line (inverted) on the below chart. The greenback is also strongly inversely correlated to the S&P 500 (green line). You can see that just when the dollar started to rise the S&P 500 commenced its decline.
Going forward, the US dollar, similarly to yields should also continue its advance on the expectations of fewer interest rate cuts by the Fed in 2024 than initially the market priced in providing the S&P 500 more room to decline.
Moving further, the next thing that may support the reasoning that the S&P 500 pullback is not over yet is the percentage of stocks trading above their 50-day moving averages.
This indicator shows that more than 88% of the S&P 500 companies trade above their 50-day moving averages. Historically, over the past 5 years, this level coincided with at least a few % pullbacks (red lines) with only two exceptions (blue lines) when we had to wait a couple of weeks more for some decline in prices.
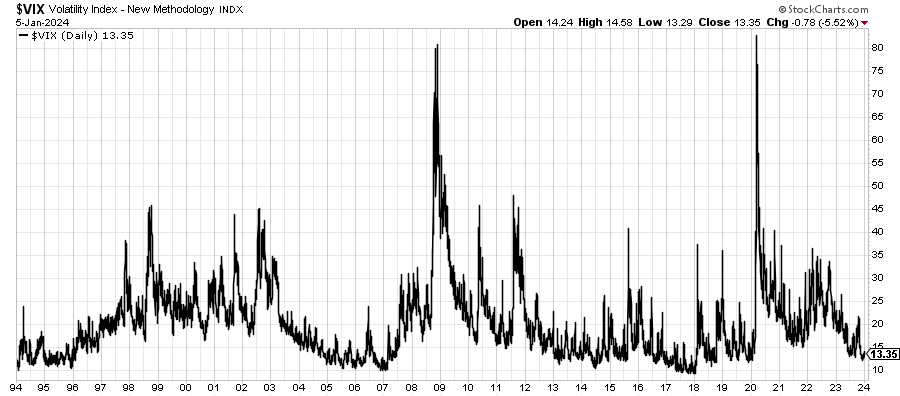
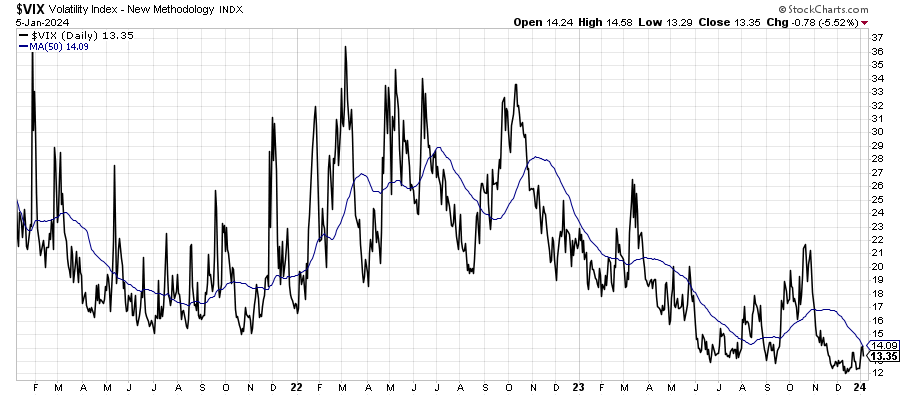
Another argument worth considering is the Volatility Index VIX’s recent moves.
The first chart presents VIX over the past 20 years. As you can see, it is trading at pretty low levels by historical standards (similar to the pre-pandemic spike in early 2020), though there have been periods where it had traded even lower of around 10 points. On the second chart, you can see the index over the past three years compared to its 50-day moving average. We can read from it that it was pretty uncommon for the index to trade below its average for more than several weeks. In other words, currently, there’s almost no fear in the market and if anything negative arises then we may expect VIX to spike. From the technical perspective, a rise to 19-20 points would not be a surprise. This, in turn, will support the S&P 500 decline and may provide a better entry point for investors with medium and long-term investment horizons.
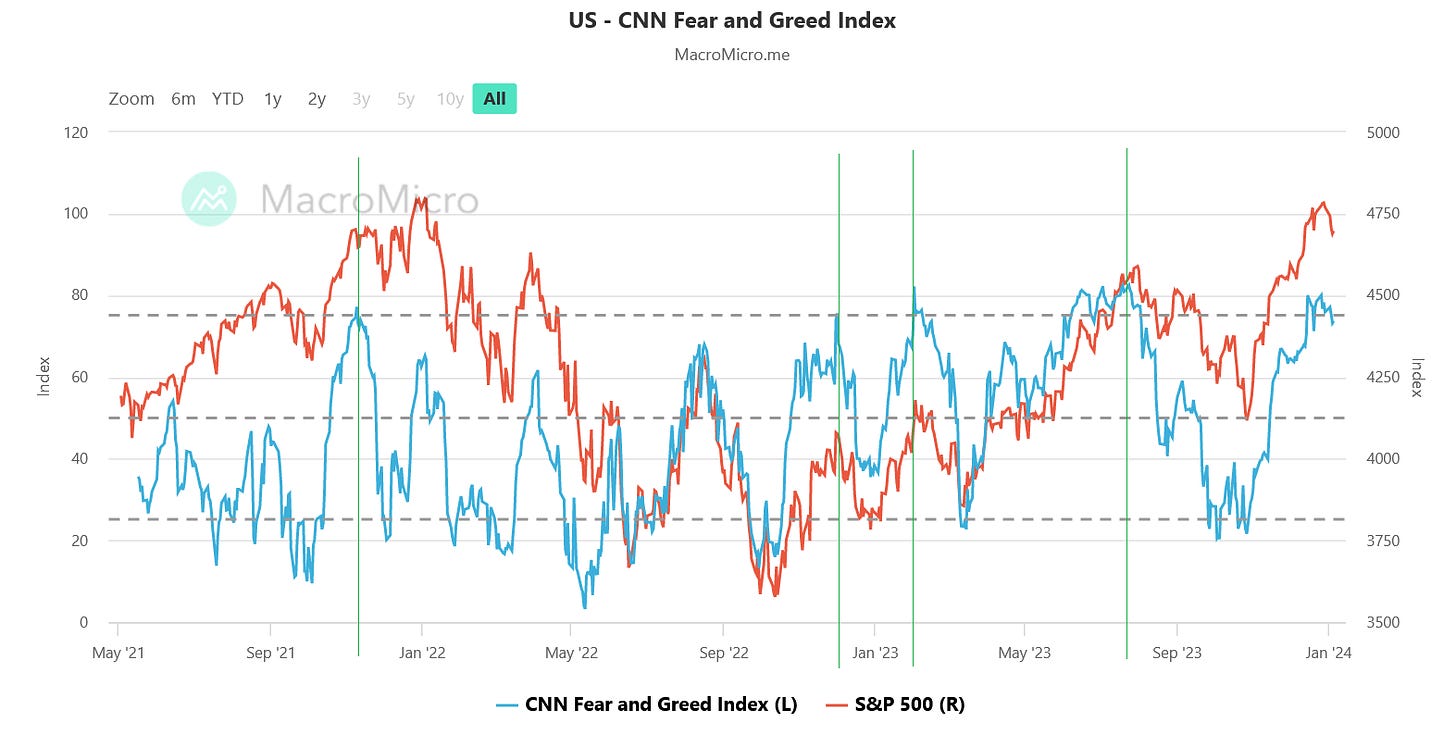
Speaking about the sentiment, CNN’s Fear & Greed index has been still showing greed after falling a few points from extreme greed levels last week. Historically, this indicator has also been a good barometer in anticipating the S&P 500 turning points. It is based on seven different indicators: 1) Market momentum (S&P 500 and its 125-day moving average), 2) Stock price strength (Net new 52-week highs and lows on the NYSE), 3) Stock price breadth (McClellan Volume Summation Index), 4) 5-day average options put/call ratio, 5) Market volatility (VIX and its 50-day moving average), 6) Safe haven demand (Difference in 20-day stock and bond returns) and 7) Junk bond demand (Yield spread: junk-high yield bonds vs. investment grade).
In the second chart, you can see, how many ‘sell’ signals the Fear and Greed index has provided over the past 3 years. It was when the index reached at least 75 points meaning there’s extreme greed in the market. Last week this indicator produced another ‘sell’ signal again.
CONCLUSION
In summary, I think that the pullback in the S&P 500 has just started and will likely continue early this week as there are not many catalysts except for a few Fed speakers. However, the view might have changed after CPI and PPI inflation data in the US which are due on Thursday and Friday, respectively. If they come up in line or lower than expected then it will likely provide a green light for stocks to rise. Moreover, the next earnings season kicks off in the United States with major banks releasing their results for Q4 of 2023 on Friday. Anything unexpected from the world’s largest financial institutions may also change the sentiment rapidly.
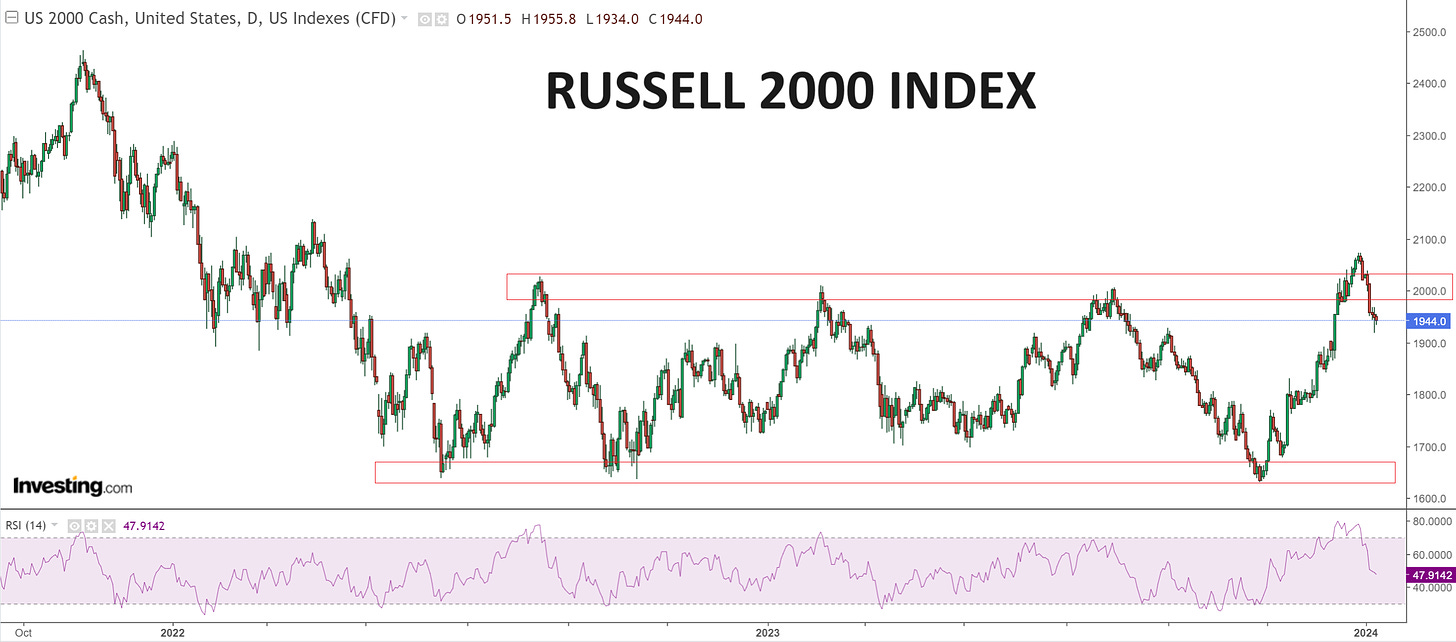
PS. If you are on X (formerly Twitter), I’d like to leave here a warning. If you follow large X accounts with 10-100K+ followers do not take for granted everything they say. Their narrative quickly changes with the asset prices change. In the chart below, you can see the price of the Russell 2000, the index of 2000 small capitalization stocks listed in the United States. As you can see, the index has been trading between 1,640-2,000 range for more than 18 months. After it broke above 2,000 for a few days at the end of 2023, many X accounts celebrated this fact intensively and they were expecting the rally to continue with upside moves to accelerate. The reality is, that the move happened in the last week of the year when usually the so-called big money is on holiday and liquidity is low. When these large financial institutions and funds came back to their desks in 2024, the Russell 2000 reversed and fell below 2,000 again. Hopefully, not many people have been caught up but if they have that was a great lesson, especially for the people entering the investing world and its communities.
In the next few weeks, I will be looking closer at other assets such as gold, silver, currencies, crypto, corporate bonds, commodities, and others. If you have any ideas about what you would like to see please leave a comment here.
If you find it informative and helpful you may consider buying me a coffee and follow me on Twitter:

